
For a long time the Turkish party system has been characterized by its high fragmentation and electoral volatility.1 However, with the entry of the Justice and Development Party (Adalet ve Kalkınma Partisi-AKP) onto the electoral scene for the 2002 general elections, this diagnosis appears to be a misrepresentation of the Turkish political experience. The AKP increased its vote share and won the 2007 general election. On June 12, 2011 the AKP obtained the largest vote share in Turkish general elections for a third time in a row since 2002. From the beginning of the campaign period there seemed to be little disagreement about AKP’s victory. Although the fragmentation and volatility in the party system decreased, the total number of votes obtained by the parties that met the 10% nation-wide vote threshold and the votes of the independent candidates still remained below that of the AKP votes. Despite the fact that the regional pattern of electoral support for political parties remains more or less intact for the last three elections, the provinces where the AKP is the largest party has been constantly expanding. The fact that the AKP has consistently increased its vote share, giving it a clear control of the majority of seats in the Turkish Grand National Assembly (TGNA) for the past three consecutive elections with about 50% of the valid votes in 2011, is enough of a reason to suggest that the AKP’s tenure has transformed the Turkish party system into a dominant party system.
Three characteristics distinguish dominant parties in competitive parliamentary systems. One concerns the vote or seat shares in representative assemblies obtained by the parties in the system. Other concerns the nature of the opposition against such parties and the third concerns the time-span over which these parties acquire a certain majority of the votes and seats. Since in the Turkish party system the seat shares are a function of the 10% threshold in the post-1980 period, I will focus primarily on the vote shares rather than seat shares as a criterion. As to the duration criterion, there appears little agreement as to the concrete period over which repeated election victories should be observed to qualify for a dominant party system.2 Only Sartori provides a clear operationalization and explains that three consecutive election wins are the criteria for a system to qualify as a dominant party system.3
The nature of the opposition facing a dominant party is also often discussed. The opposition is typically divided and dispersed with inferior bargaining positions in shaping the policy agenda within the party system, thus, rendering the dominant party’s job in office relatively easier. In other words, a weak opposition is conducive to facilitating a dominant party.
Electoral appeal or power in elections is the operational defining characteristic of a dominant party. Lack of competition against it is not what makes a party dominant. In dominant party systems there typically are a number of competitors. However, who will be the electoral winner is considered a formality. Sartori operationalizes the idea of a dominant party as “..a party that outdistances all the others (and thus) is significantly stronger than others” (italics added).4 Sartori assumes that a 10 percentage point spread between the stronger and the other parties suffices for it to qualify as a dominant party and he provides a list of some twenty countries as examples.5 If we take this criterion alone, there are three periods in the Turkish multi-party politics era that could qualify as a dominant party regime. The Democrat Party (Demokrat Party-DP) secured about 13 and then 22 percentage points advantage over the Republican People’s Party (Cumhuriyet Halk Partisi-CHP) in the 1950 and 1954 elections. Then the Justice Party (Adalet Partisi-AP) in two successful elections in 1965 and 1969 obtained about 24 and 19 percentage points over their closest competitor at the time, the CHP. The Motherland Party (Anavatan Partisi-ANAP) in 1983 and 1987 remained about 15 and 12 percentage points above the inheritors of the CHP in the post-1980 coup period, the People’s Party (Halkçı Parti-HP) and Social Democratic People’s Party (Sosyal Demokrat Halkçı Parti-SHP).
With the results of the June 2011 general elections, the AKP satisfies the Sartori criterion of three electoral victories in a row with a large enough margin over its competitors.6 In fact, the AKP’s electoral victory margin over the CHP was about 15 percentage points in 2002 and then it increased to about 25 in 2007, and was about 24 percentage points in 2011. Moreover, the divided and stagnant nature of the opposition in contrast to the increased geographic reach of the AKP vote are all signs that the AKP has emerged as a dominant party.
Sartori’s earlier classification places Turkey in the same category as Japan (1969), Sweden (1970), India (1967), and Italy (1972) among others.7 Bogaards finds many examples of dominant parties and classifies numerous African democracies of the 1990s and early 2000s as dominant party systems.8 The Liberal Democratic Party of Japan, which remained in power almost continuously for nearly 54 years from its founding in 1955 until its defeat in the 2009 election, is a typical example of a dominant party. The Norwegian Labour Party ruled from 1935 to 1965, while the Swedish Social Democratic Party remained in power almost continuously from 1932 to 1976. They are both historical examples of dominant parties in Europe. Ware distinguishes the case of Italy, for example, where “one party is much larger than any of the others that can join the government and is thereby the dominant member of any coalition government.”9Though similar in some respects, unlike the Italian case, generally the dominant party’s links and relations with organized economic interests are rather distinct and built on much more self-confidence and hierarchy compared to Italy’s experience.
Several features of a dominant party system are worthy of note. One concerns the tendency of the dominant party in power to become complacent. Thus, it increasingly takes for granted its leading position as “guaranteed.” The real political competition ceases to be between different parties but rather between factions within the dominant party organization. As outlined in the above depiction of dominant party definitions, a dominant party era is also one where opposition parties are also in total disarray. Since there is no realistic chance of making a difference within the opposition parties, all interest groups target and mobilize competing groups within the dominant party. Consequently, the unmaking of the dominant party is largely due to internal party struggles.10 Another development in dominant party systems is that increasingly the difference between the party in power and the state loses its distinction. As a result of both developments, the likelihood of large-scale corruption and the abuse of power emerge. Coupled with complacency of the dominant party organization and the lack of a viable opposition to compete for power, the state’s bureaucracy loses its autonomy and increasingly acts as a rubber stamp agency for the dominant party government. Such a development inevitably leads to increasing inner party struggles that feed on political degeneration and corrupt practices, which eventually undermine the tenure of the dominant party.
I have two objectives in the ensuing sections. One is to provide a simple descriptive account of the June 12, 2011 general elections at the provincial level in comparison with the recent elections at the local as well as the national level. Another one is to underline the implications of these results from the conceptual perspective of a dominant party and a dominant party system. I will conclude with a speculative evaluation of future developments in the electoral scene and underline the research questions that remain unanswered about the June 2011 elections.
Election Results at the National Level
Table 1 presents the main indicators for the last four general elections since 1999. The total number of registered voters, in the first election when the AKP won 34.3% of the valid votes, was approximately 41.4 million. After a modest 3.4% increase in 2007, the number of registered voters rose by 23.4% in 2011 and reached approximately 52.8 million. Such a sharp increase is attributable to a new Address Based Population Registration System (ABPRS).11 In 2002, the participation rate was 79.1%, down from 87.1% in 1999. In 2011, 83.2% of the registered voters cast a valid vote; again slightly lower than the participation rate in 2007. Participation rates in Turkey remain quite high compared to many countries. However, a comprehensive study by the International Institute for Democracy and Electoral Assistance shows that Turkey ranks 44th among a total of 169 countries and 14th among the 25 Western European countries included in the study with about 81% average participation rate for 10 competitive elections of the post-war era.12
The total number of valid votes has also steadily increased despite fluctuating participation rates. While in 1999, 83.2% of the registered voters cast a valid vote, in 2002 this ratio was down to 76.1% and in 2011 it rose again to 81.3%. Despite a growing population of eligible voters and participation rates in excess of 80%, the number of invalid votes cast has steadily declined since 1999 from about 1,5 million voters to about 0.9 million voters in 2011.
Table 1. Results of the General Election of Representatives, 1999-2011

Source: For 1999 to 2007 see: http://www.tuik.gov.tr/VeriBilgi.do?tb_id=42&ust_id=12 For 2011 see http://www.ysk.gov.tr/ysk/docs/Kararlar/2011Pdf/2011-1070.pdf
What is perhaps most remarkable in the 2011 results, in comparison with the previous two general elections, is not only the AKP’s steadily rising share of the vote but also the sheer number of votes cast for the AKP. The AKP got 10.8 million votes (34.3% of the valid votes) in 2002, 16.3 million in 2007 (46.6% of the valid votes), and approximately 21.4 million (49.8% of the valid votes) in 2011. As such, over the course of about nine years, the number of votes cast for the AKP has nearly doubled. This is primarily attributable to a steady melt-down of electoral support for the centre-right parties, such as the Motherland Party (Anavatan partisi-ANAP), the True Path Party (Doğru Yol Partisi—DYP) or its continuation as the Democrat Party (Demokrat Parti-DP) and the once sizeable reactionary force under the Young Party (Genç Parti-GP) as well as the old-guard traditionalist parties under the National View (Milli Görüş) movement such as the Felicity Party (Saadet Partisi-SP) and the People’s Voice Party (Halkın Sesi Partisi-HSP) (see Figure 1). These two groups of parties had about 25% of the vote in 2002, which declined to about 10.9% in 2007 and then down to about 2.7% in 2011. The Nationalist right-wing remains at around 13 to 14% of the vote and the left-of-center and ethnic Kurdish parties and independent candidates remain at about 6 to 7%. The center-left tradition of the Republican People’s Party (Cumhuriyet Halk Partisi-CHP) and the Democratic Left Party (Demokratik Sol Parti-DSP) has declined down to about 20% in 2002, and appears to have been consolidated under the CHP. It has increased its vote share by about 5 percentage points in 2011 while the DSP has virtually disappeared from the electoral scene.
Since the AKP and the CHP are the only two parties with significant increase in their electoral support in 2011, an impression that needs to be tested with individual level survey data is that the electoral melt-down of the National View as well as the center-right electoral traditions has helped build the new electoral base for these two winners in 2011.13 While it is more likely that the AKP benefited from voters who left the National View parties, the CHP could have benefited to some degree from voters of the center-right wing tradition.
The total number of votes obtained by the SP and HSP increased by only about 60 thousand from 2007 to 2011 and remained at around 870 thousand votes. However, the number of votes for the DP and GP declined by about 2.6 million. In other words, the center-right-wing constituency appears to have shifted primarily to either the AKP or the CHP. The real puzzle here concerns voter choices of the new first time voters, which form a voter block of more than 10 million that were added to the voters’ registry between 2007 and 2011. Some of the voters who were registered in 2007 have dropped out of the registry for natural causes, such as death, for example. So, first time voters are actually more than the difference between the registered voter figures between 2007 and 2011 unless the registration figures for 2007 were actually below the actual number of eligible voters. However, with only macro-level election results, we cannot resolve this puzzle. Obviously, although quite unlikely, some of the voters who might have voted for the existing parties in 2007 might have shifted to the AKP or CHP and first time voters might have replaced them. However, since the National View tradition parties as well as the center-right tradition parties consist of less than three percent of the vote in 2011, the real question concerns the new party of choice for these two electoral traditionalist voters and the party choices of the first-time voters in 2011.
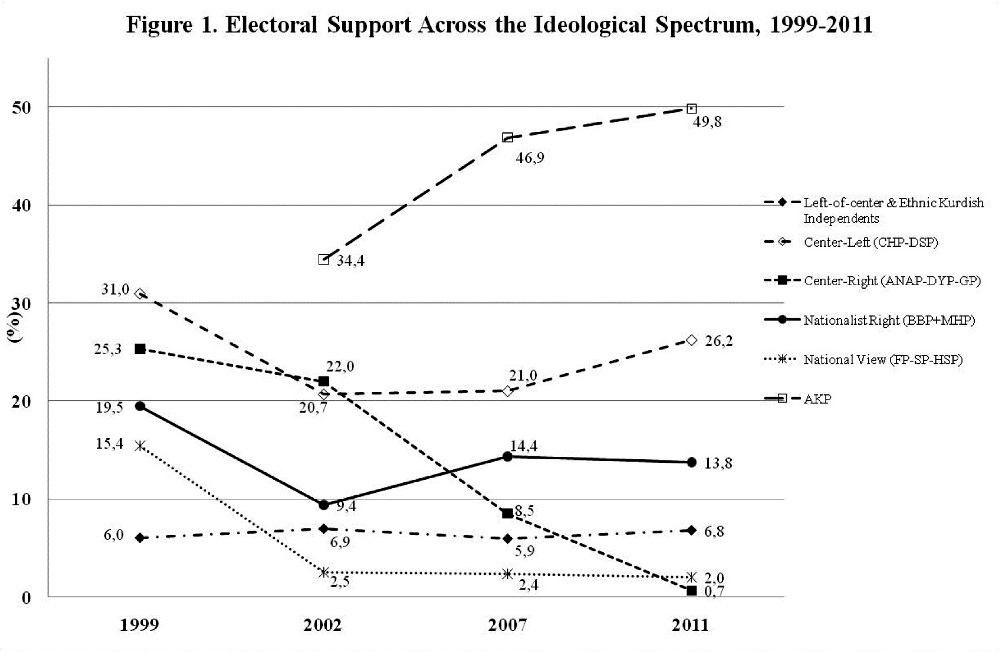

Volatility and fractionalization of electoral support has long been a defining characteristic of the Turkish party system.14 With the entry of the AKP into the system in the 2002 general election, volatility naturally increases but fractionalization of electoral support remains more or less the same as in 1999 (see Figure 2). However, ever since 2002, both indicators show a steady decline and as of 2011 only about 10% of the electorate appears to have shifted from one party to another compared to 2007. The fractionalization index has steadily declined since 1999. In 2002, the effective number of parties implied by the fractionalization index was about 5 - while in 2007 and 2011 this number declined to about 3 parties. Both indices clearly show a consolidation and stabilization of electoral preferences.
The Nature of Change in Provincial Election Results
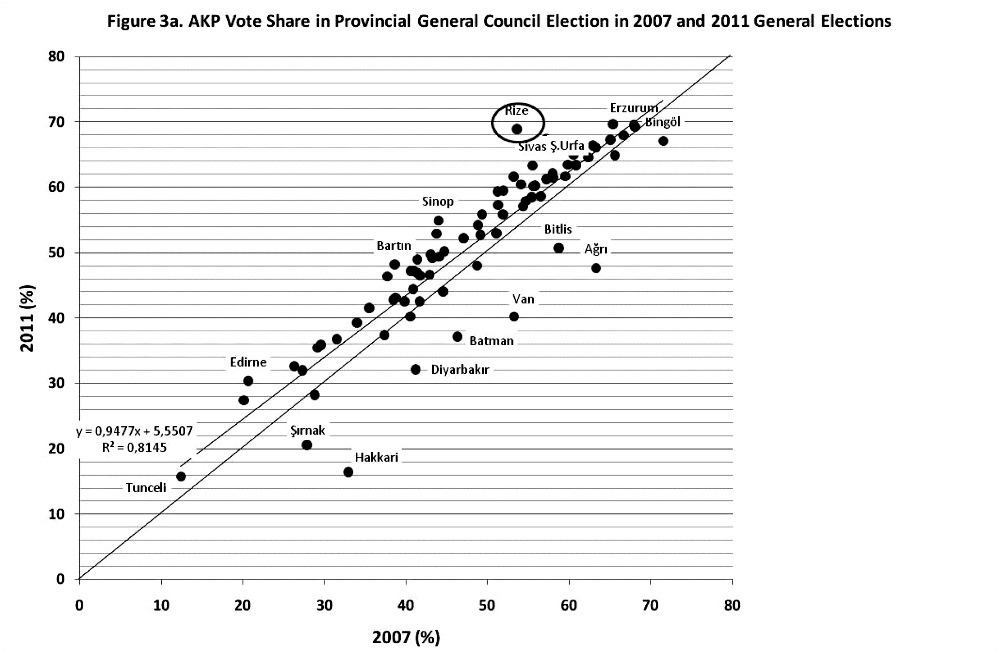
A simple description of election results across provinces is obtained by plotting pairs of provincial vote shares of parties across two elections. Figure 3a below gives such a depiction for the AKP in two consecutive general elections of 2007 and 2011.15 Every observation of this figure corresponds to a provincial election result for the AKP in the two elections. For example, in the case of a province such as Rize, the AKP obtained about 54% of the vote in 2007 and increased this share to about 69% in 2011. The main diagonal line on this figure shows the points for which the vote shares are the same for both elections in 2007 and 2011. So, any actual observation such as the one for Rize, which falls above the main diagonal line, represents a situation where the vote share for the province has increased from 2007 to 2011. Any point that lies below the main diagonal line corresponds to a province where the vote share for 2011 has decreased compared to 2007. In Rize, Sinop, and Elazığ the vote share of the AKP has increased by more than 10 percentage points. In 29 provinces the AKP obtained an increase between 5 to 10 percentage points and in 34 provinces it obtained between 0 to 5 percentage points. In only 15 predominantly East and Southeastern Anatolian provinces the AKP incurred a loss compared to its vote share in 2007.
With this analytical tool in mind, we see that for the AKP, the scatter of provincial election results is first of all predominantly above the main diagonal line showing an overall increase in the AKP’s vote share for 2011 compared to 2007. The few provinces which lie below the main diagonal line show predominantly eastern and southeastern Anatolian provinces, such as Ağrı, Batman, Bingöl, Bitlis, Diyarbakır, Hakkari, Şırnak, and Van.
The summary measure of the scatter of provincial results in this figure is shown as the regression line taking the 2011 results as a function of the 2007 results. The slope of this line shows that as provincial electoral support for the AKP in 2007 rises so does the support for the AKP in 2011. By running the AKP’s vote share across provinces in 2007 as a predictor of its vote share for 2011, as shown on the same figure with a separate estimated regression line, we actually can summarize how AKP’s votes in 2007 are translated into vote shares in 2011. This is a summary measure of success for a party to hold on to and even increase upon its vote share from one election to another. The slope coefficient for the AKP’s vote share in 2007 is less than unity and thus shows a small overall decline for 2011 provincial returns that are due primarily to declining votes for the AKP in southeastern and eastern Anatolian provinces. In more technical terms, only about 95% of a percentage point increase in 2007 is met in 2011 and thus the slope is lower than the main diagonal line that corresponds to a slope of unity.
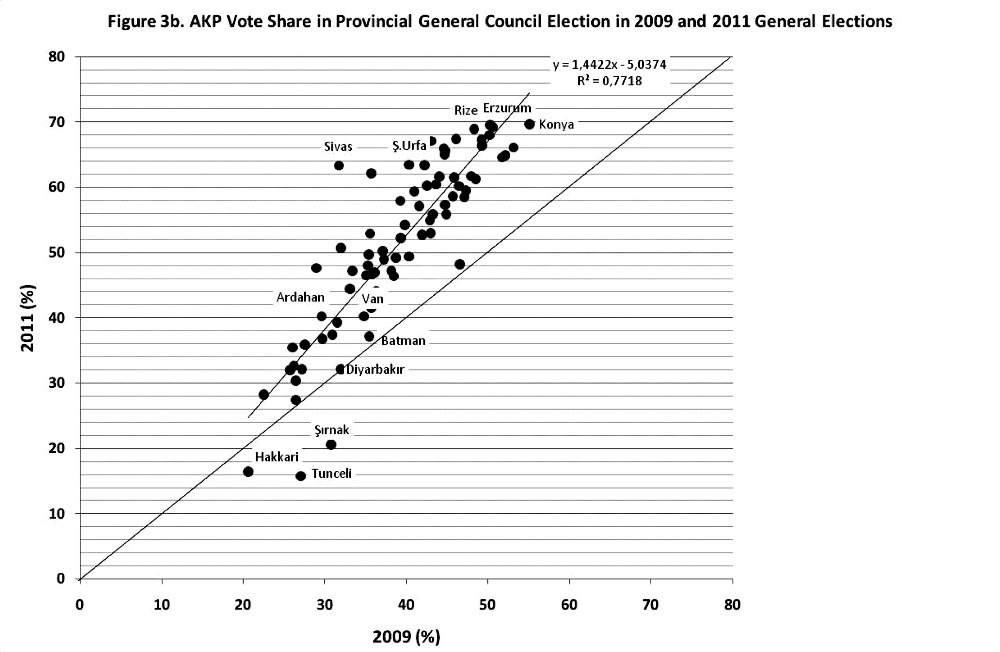
If we were to show the 2011 provincial results as a function of the 2009 Municipal Council election vote shares across provinces, we obtain quite a different picture (see Figure 3b).16 In this case the AKP’s vote share has declined in only three provinces that lie below the main diagonal line (Hakkari, Tunceli, and Şırnak). In all other provinces the AKP’s vote shares in 2011 are higher than those for 2009. The regression line summarizing this relationship between 2009 and 2011 results is also much steeper showing that for every 1 percentage point increase for the 2009 results, 1.44 percentage points are observed in 2011. This is an impressive improvement for the AKP. Since it only incurred losses in three provinces but in all others it has either obtained about the same vote share or substantively improved upon its performance for the 2009 Municipal Council elections. For example, in Sivas the AKP improved upon its vote share in the 2009 Municipal Council election results by 31.6 percentage points and got 63.3% of the valid votes. Similarly in Kırıkkale, the AKP reached 62.1% in 2011 over its 35.7% in 2009. In Çanakkale, the AKP increased its vote share from 2009 Municipal Council elections by 5.89 percentage points, in Aydın by 9.42, in İzmir by 7.09, and in Muğla by 6.49 percentage points. In all other Aegean provinces such as Afyon, Balıkesir, Denizli, Kütahya, Manisa, and Uşak, the AKP’s increase over 2009 exceeded ten percentage points. In other words, resistance to AKP’s electoral appeal still seems effective in the coastal provinces of the Aegean despite its apparent weakening and slide towards the AKP in 2011.
The AKP expanded its dominance well into the western coastal provinces and remains a dominant electoral force in all major metropolitan areas with the exception of İzmir
In other words, the AKP has improved upon its vote shares in 2011 across provinces in a much more pronounced fashion in a comparison with the 2009 rather than the 2007 results. The deteriorating support for the AKP in the 2009 Municipal Council election results thus appears to have stopped and has been reversed. Not surprisingly, a complete opposite pattern is observed for the CHP when we compare its vote shares across provinces for the 2007 and 2011 general elections and the 2009 Municipal Council elections.
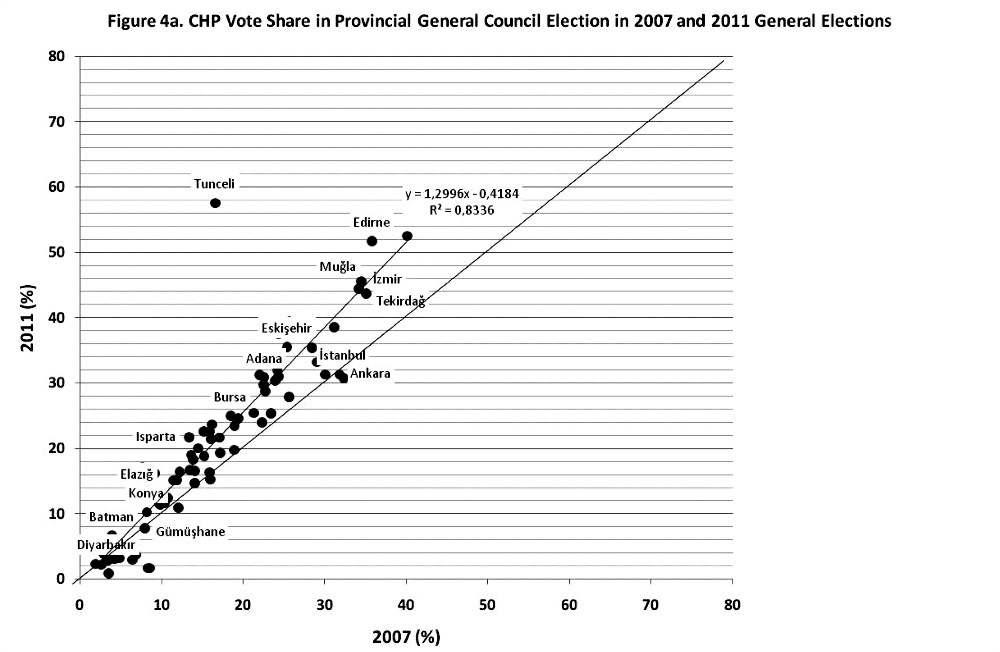
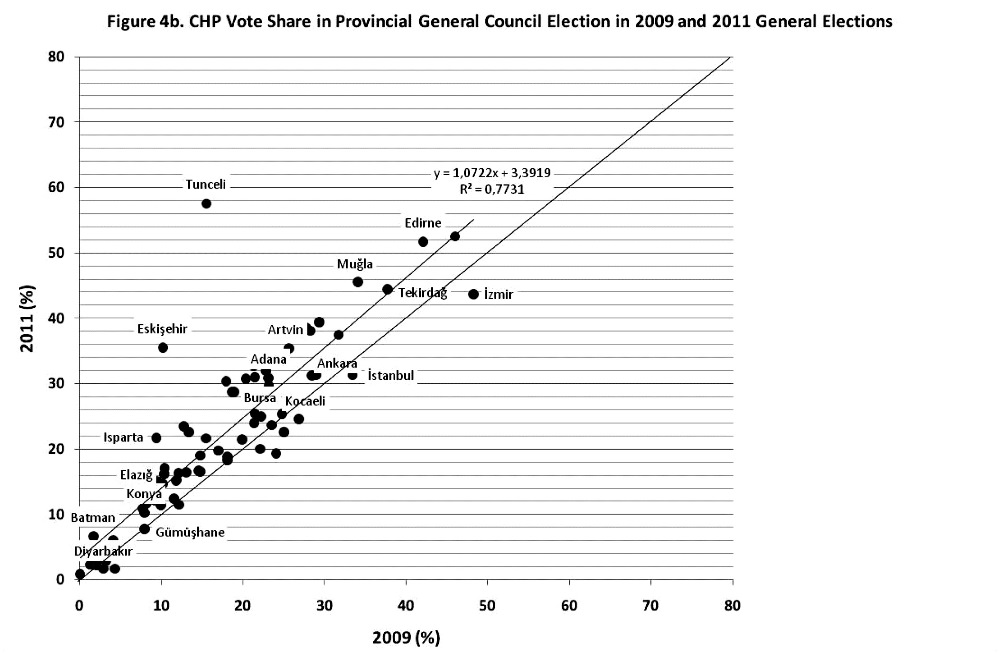
Compared to the 2007 results, the provincial vote shares for the CHP have increased. The summary slope coefficient for the CHP in this case is only 1.30 and is significantly higher than 0.95 observed for the case of the AKP in this comparison of 2007 and 2011 results. In Tunceli, for example, where the CHP’s vote was about 17% in 2007, it rose to about 58% in 2011. Similarly, in 10 provinces such as Edirne, Çanakkale, Aydın, Zonguldak, Kırklareli, Muğla, Tekirdağ, and Eskişehir the CHP vote share increased from 2007 to 2011 by more than ten percentage points. In 25 provinces, the CHP obtained an increase between 5 to 10 percentage points and in 31 provinces it obtained between 0 to 5 percentage points. Again, similar to the AKP, in only 15, predominantly East and Southeastern Anatolian, provinces the CHP incurred a loss over its vote share in 2007. In other words, the CHP’s win over its support levels of 2007 is relatively larger. Nevertheless, compared to the 2009 results, the picture is much different. Although the number of provinces wherein gains of different magnitudes are observed does not change much from the comparison of the 2007 and 2011 results, the magnitudes of these changes are such that they render the slope coefficient of the corresponding regression much smaller compared to the previous comparison between 2007 and 2011. For every percentage point gain in 2009, the CHP vote in 2011 rises by a mere 1.07 percentage points.
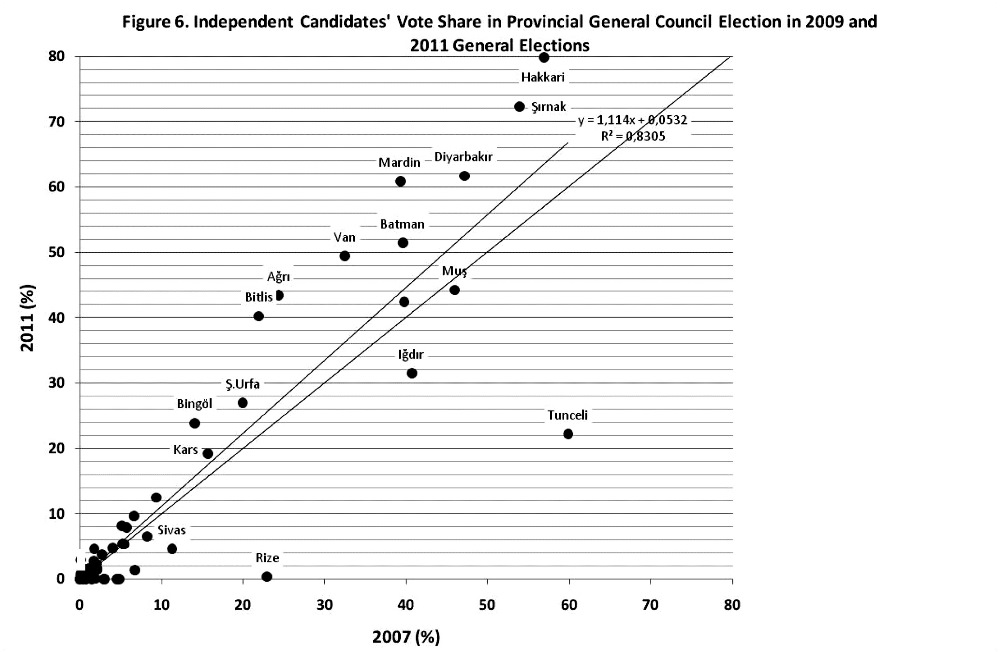
Although the independent candidates supported by the BDP have expanded their support, this expansion came primarily in the smaller Eastern and Southeastern Anatolian provinces where the AKP was still able to hold on to a significant electoral support
What is perhaps most revealing is the regional distribution of the CHP vote. In both comparisons, the provinces at the very bottom left corner of the figures showing the CHP vote in three elections are the provinces of the Eastern and Southeastern Anatolian region. In provinces such as Diyarbakır, Hakkari, Bingöl, Bitlis, Van, Muş, Siirt, and Şırnak the CHP vote share remains less than a mere 5%. This is contrary to the expectations created prior to the election especially after what looked like a successful campaign meeting in Hakkari and the preceding efforts of the CHP to develop its party positions concerning the Kurdish issue in order to appeal to the population of the region. However, it appears that these efforts have largely remained ineffective. A similar disillusionment appears in provinces such as İzmir and Gaziantep where the CHP vote increased over the 2007 general election vote shares in the 2009 Municipal Council elections, but then in 2011 it declined by about 4.5 percentage points. Similarly, in İstanbul, Kocaeli, and Bolu it suffered a 2 percentage point loss over the 2009 results. Such poor performance in the larger population provinces appears to have limited the CHP gains.
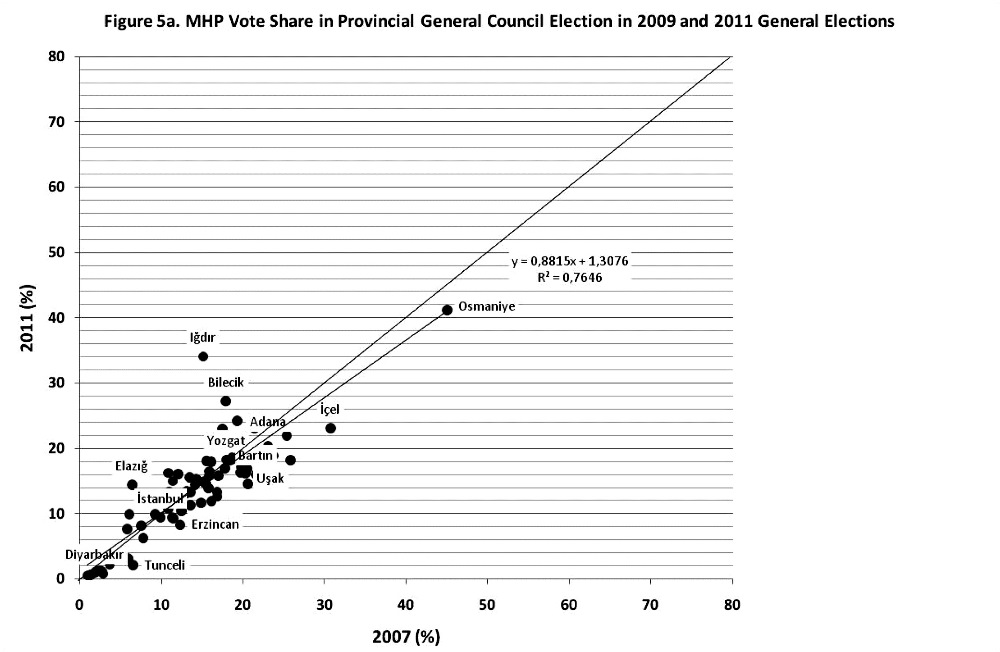
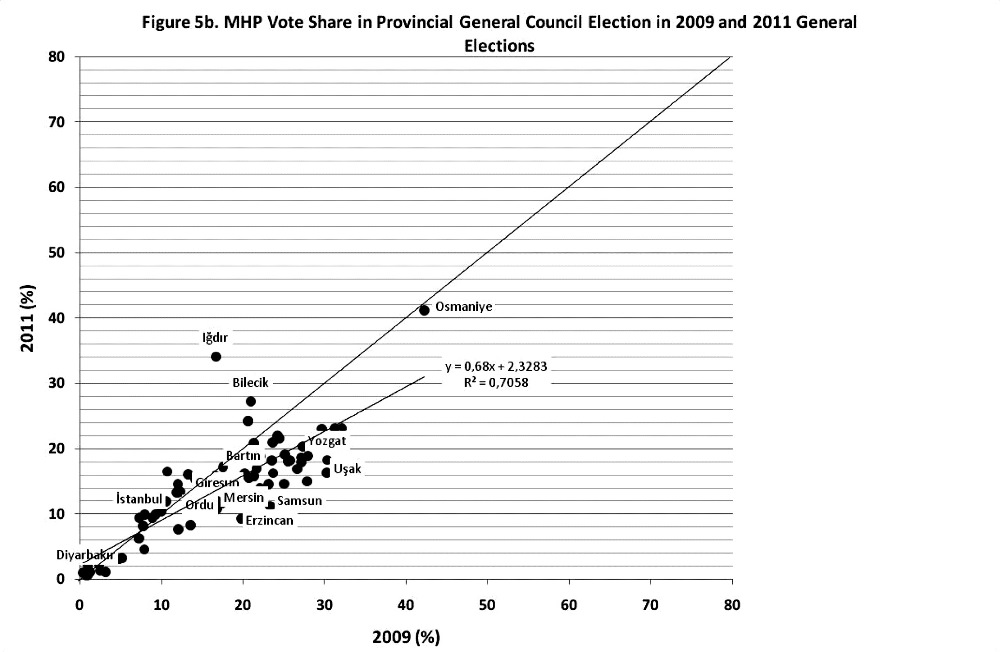
Figures 5a and b show the same analyses for the MHP. What is striking in these figures is the obvious deterioration in 2011, especially in comparison to 2009. Only 0.88 of 1 percentage point increase is carried from 2007 to 2011 and a much lower 0.68 of 1 percentage point is carried from 2009 to 2011. Not surprisingly, the MHP vote shares in Eastern and Southeastern provinces remain very low. In 57 of 81 provinces, the MHP has lost vote share in 2011 compared to 2009 and in 51 provinces it lost votes compared to 2007. In other words, the loss region for MHP has been expanding for the last two elections. The largest vote share increase in excess of 5 percentage points in 2011 compared to 2009 for the MHP took place in Iğdır, Bilecik, and Kırklareli. In Eastern provinces, such as Muş, Ardahan, Tunceli, and Van the MHP gained between 1 to 5 percentage points. Again the gains for the MHP in larger metropolitan provinces such as Istanbul and İzmir remained modest, around 1 to 2 percentage points, and in Ankara the MHP incurred a significant loss of about 10 percentage points over 2009. The largest losses appeared in the Aegean region provinces, such as Çanakkale, Muğla, Denizli, Aydın, Manisa, Afyon, and Uşak. In Ankara, Samsun, Yozgat, Sakarya, and Erzincan the MHP vote share declined by more than 10 percentage points compared to its 2009 Municipal Council election results. These results underline another major puzzle for the 2011 election results: where did the voters of the MHP go? Did they vote for the AKP or the CHP? Answering these questions will clarify the emerging pattern of electoral consolidation behind the AKP and its dominant position in the system as well as the nature of the main opposition party’s electoral bases. The possibility of electoral movement between the CHP and MHP arises from speculations concerning the dynamics that were initiated by the tape scandals concerning the MHP elite during the campaign period. A net flow away from the MHP appears to have occurred between 2009 and 2011. However, such macro picture still leaves the possibility of some CHP voters having switched strategically to the MHP in order to keep it above the 10% threshold. Such “borrowed” voters from the CHP within the MHP constituency will obviously affect the nature of competition in the party system.
As to the independent candidates’ vote shares, it is only relevant to compare the 2007 results with those of the 2011 since in local elections different dynamics and expectations are effective for the independent candidates. We see from Figure 6 below that an overall gain especially in the Eastern and Southeastern provinces emerges. Independent candidates gain more than 20 percentage points in Hakkari and Mardin. In Ağrı, Batman, Bitlis, Diyarbakır, and Şırnak the independents’ gain is between 10 to 20 percentage points and in Şanlıurfa and Bingöl the gain is between 7 to 9 percentage points. Large losses in Tunceli and Rize are due to changes in the status of candidates who withdrew from competition or their partisan status. In large metropolitan provinces - such as İstanbul, Ankara, İzmir, Bursa, and Adana - small rather than large changes are incurred by the independent candidates. In conclusion, the independent candidates of the BDP remain restricted to their old bases of support in the Eastern and Southeastern provinces and a limited number of provinces such as Istanbul and a new rise of support in Adana and Mersin.
Conclusion
The first and most significant result of the June 2011 general election is the consolidation of the AKP’s electoral power base. The fact that smaller right-wing parties other than the MHP have virtually disappeared from the electoral scene is the most significant outcome of this election. However, pending new research results with individual level data, the remaining right-wing opposition of the MHP might have already changed due to strategic voters who would have normally voted for the CHP, for example.
Macro indicators of volatility and fragmentation of electoral support both illustrate the stabilization and consolidation of the AKP’s electoral appeal. Similarly, even a cursory look into the geographic distribution of support for major parties and independents also reveals supporting evidence of the consolidation hypothesis. The Turkish electoral scene now has a clear geographic pattern. The AKP expanded its dominance well into the western coastal provinces and remains a dominant electoral force in all major metropolitan areas with the exception of İzmir. The opposition of the CHP retreated back into the western coastal provinces and lost significant electoral ground in places like İzmir, Gaziantep, and İstanbul especially compared to 2009. The MHP’s once increasing appeal out of its traditional support bases of inner Anatolian provinces and into the western provinces appears to have stopped and retreated.
The independent candidates, who are not supported by well-established party organizations, have failed to attract any significant vote shares. Compared to 2002 and 2007, this is a significant change that limits the electoral and ideological scope of the Turkish party system. However, although the independent candidates supported by the BDP have expanded their support, this expansion came primarily in the smaller Eastern and Southeastern Anatolian provinces where the AKP was still able to hold on to a significant electoral support. In other words, the East and Southeastern Anatolian region, which are predominantly Kurdish, is represented by the BDP and the AKP.
The still unfolding crisis of the BDP’s boycott of the Parliament is significant because it leaves the opposition Kurdish ethnicity representatives out of the Turkish Grand National Assembly. The fact that the CHP also boycotts the Assembly because a number of its elected candidates are not able to take the oath and start their assembly membership adds to the severity of the crisis of representation in the Assembly. The implications of this boycott crisis go beyond the scope of this analysis. However, from a purely geographic-electoral perspective both these parties’ electoral support bases are severely shaped by geographical cleavages. While the BDP support is concentrated in the East and Southeastern regions, the CHP’s support is heavily concentrated in the Western coastal provinces. Although the AKP support and consequently its representatives are present in both these regions, a deeper division exists between the CHP and BDP on many of the constitutional reform issues on the agenda. Consequently, unless averted and resolved, the boycott crisis creates a legitimacy debate that severely limits the ability of the new Assembly to draft a new constitution aiming to address many issues concerning the status of Kurdish ethnicity. The fact that almost 95% of the valid votes cast effectively found representation in this Assembly despite the 10% threshold could be used as a sound basis of legitimacy for making a new constitution in the Assembly. Such a debate over the legitimacy issues carries the danger of hampering and effectively depleting the energy and political capital that could be used to build consensus around a new Constitution.
Unless a significant weakening in the AKP’s political and economic performance takes place and an effective and credible opposition party emerges in the system, significant electoral shifts appear unlikely in the near future
On purely electoral grounds, it could be argued that a dominant party system is now taking shape in Turkey. Such a system is expected to create a stable and more predictable political environment. One should note that typically dominant party systems not only create stability and predictability but also give rise to tendencies of increased internal party conflicts in the dominant party as well as rising trends of corruption. Such dispositions also necessitate careful policymaking to counteract these trends. The fact that a significant portion of AKP parliamentarians have been renewed during the candidate selection process is a good sign that the AKP leadership has made a healthy choice that could effectively maintain new blood and fresh energy within the party.17 A similar renewal of the elite cadres at lower levels of party organization and greater reliance on merit based promotion of the political cadres from grassroots towards the top echelons of the party organization is also expected to help counteract the weakening trends within the AKP organization due to its long tenure in office. A potential danger at this juncture for the AKP would be a heavier reliance upon the party leader’s authority to reshape the party organization. This is likely to create tension and fractions within the party that could prove difficult to control in the middle to long run. Hence, a more attentive reshaping and work to maintain the party’s recruitment may be needed to revitalize the AKP party’s organization at the grass roots. This effort will counter tendencies towards greater complacency due to a lack of an effective opposition in Turkey’s political party system. In other words, lacking effective opposition in the system, the dominant AKP needs to reinvent ways of keeping its political machine at the cutting edge of electoral dynamism that will keep it dynamic, united, and avoid political degeneration.
It is pure speculation to forecast what will happen in the future elections. However, it looks like the electoral base of the AKP has matured and expanded to include a diverse group of older electoral traditions of the Turkish center right-wing. The National View as well as the center right voters of the ANAP-DP-GP appear to have come under the electoral umbrella of the AKP. A primary reason for this grand coalition appears to be perceived success of the AKP tenure on the economic front. Continued economic growth should help maintain this coalition in future elections. It appears again partially speculative that since mild economic problems are unlikely to seriously shake this dominant party electoral coalition, then the opposition will have to establish its own credibility to appeal to the uneasy electoral constituencies. Credibility of the opposition parties or the lack of such credibility is directly linked to organizational as well as intellectual and ideological maturity of these parties. The disarray that defines these parties in this respect is perhaps a critical factor that shapes the AKP’s dominance in the Turkish party system. Hence, any significant change in the future electoral scene of the country is critically linked to the state of the opposition parties as well. Unless a significant weakening in the AKP’s political and economic performance takes place and an effective and credible opposition party emerges in the system, significant electoral shifts appear unlikely in the near future.
With further research on the 2011 election, the following questions need to be answered: First, what were the predominant party preferences of the first-time voters in June 2011? Second, what were the main dynamics shaping the continuing appeal of the AKP? Third, with the enlargement of the AKP’s electoral appeal, how strong are the longer-term ideological factors as opposed to relatively shorter-term factors that may be shaped on the basis of performance evaluations? Fourth, what were the main reasons why the independent candidates were able to raise their electoral support while the MHP lost electoral ground? Fifth, to what extent did the sex tape scandals that hit the MHP elites impact this electoral decline? To what extent did the MHP and CHP constituencies in earlier elections come to support one another in the 2011 election? Finally, in this respect, how influential was the campaign and its media coverage in shaping the voters’ party preferences?
Endnotes
- On the historical characteristics of the Turkish party system see Ali Çarkoğlu, “Turkish Party System in Transition: The Connection between Macro-Level Party Competition and Agenda Change in Election Manifestoes,” Political Studies, No: XLVI, (1998), pp. 544-571; Sabri Sayarı, “The Changing Party System,” in Sabri Sayarı and Yılmaz Esmer (eds.) Politics, Parties and Elections in Turkey (London: Lynne Riener Publishers, 2002), pp. 9-32.
- Ware states that a dominant party should “usually” win. Alan Ware, Political Parties and Party Systems (Oxford: Oxford University Press, 1995); Pempel also leaves the question open by stating that a dominant party should win over a substantial period, see T. J. Pempel, “Conclusion. One-Party Dominance and the Creation of Regimes”, in T.J. Pempel (ed.), Uncommon Democracies: The One-Party Dominant Regimes (London: Cornell University Press, 1990); in Coleman and also Van de Belle and Butler the analysis is limited to single elections. See: J.S. Coleman, “The politics of sub-Saharan Africa”, in Gabriel A. Almond and James S. Coleman (eds.), The Politics of Developing Areas (Princeton: Princeton University Press, 1960), pp. 247–368; N. Van de Walle and K. S. Butler, “Political parties and party systems in Africa’s illiberal democracies,” Cambridge Review of International Studies, Vol. 13, No. 1 (1990), pp. 14–28.
- Giovanni Sartori, Parties and Party Systems: A Framework for Analysis (Cambridge: Cambridge University Press, 1976).
- Ibid, p.171.
- Ibid, pp.171-172.
- Ibid.
- Ibid.
- Matthijs Boggards, “Counting Parties and Identifying Dominant Party Systems in Africa”, European Journal of Political Research, No. 43 (2004) pp.173–197.
- Ware, Political Parties and Party Systems, pp.159-160.
- Given this observation, any institutional arrangement that is likely to encourage more intensified intra-party competition and/or splinter parties are likely to be opposed by a dominant party such as the AKP. More precisely, the lowering of the 10% threshold in the Turkish electoral system will in all likelihood be perceived as potentially creating such dynamics within the AKP and thus be opposed by the party’s leadership.
- For detailed discussion of the ABPRS see Enver Taştı, “Address Based Population Registration System 2007 Population Census in Turkey”, (2008), retrieved from http://unstats.un.org/unsd/censuskb20/KnowledgebaseArticle10663.aspx.
- Rafael Lopez Pintor and M. Gratschew, Voter Turnout since 1945, A Global Report (International Institute for Democracy and Electoral Assistance), pp.78-79, retrieved from http://www.idea.int/publications/vt/index.cfm.
- I leave the independent candidates’ vote increase out of this analysis. Their total vote share was about 5.2% in 2007 and rose up to 6.6% in 2011 and thus remains marginal in the party system.
- Çarkoğlu, “Turkish Party System in Transition”, pp. 544-571; Sayarı and Esmer, Politics, Parties and Elections in Turkey, pp. 9-32. The volatility index (V) is calculated with the following formula where i=1,…N parties in the system : Vt=(1/2) ∑N(Vote%i,t – Vote%i,t-1). Fractionalization index F is calculated by using again N parties in the following Formula: F=(1-∑N(Vote%i,t)2). V and F vary between 0 and 1. V=1 represents completely unstable party system where all old party votes in t-1 is lost completely to new parties and V=0 represents a system where all parties obtain the same vote shares in two consecutive elections. F approaches 1 is obtained when a large number of parties obtain relatively small shares of vote and F=0 when one party obtains 100 percent of the votes thus Vote%i,t =1. For volatility index see, Mogens N. Pedersen, “The Dynamics of European Party Systems: Changing patterns of Electoral Volatility”, European Journal Political Research, Vol. 7 (1979), pp.1-26; Douglas Rae, The Political Consequences of Electoral Laws (New Haven: Yale University Press, 1967).
- For a similar analysis of the 2009 local elections see Ali Çarkoğlu, “Turkey’s Local Elections of 2009: Winners and Losers,” Insight Turkey, Vol. 11, No. 2, (April 2009), pp. 1-18.
- 2009 Municipal Council election results are obviously part of the overall trends in a local election. Nevertheless, Municipal Council elections reflect dynamics that resemble a general election and thus are often used in comparison to general election results. For similar analyses and defense of such a comparison see Çarkoğlu, “Turkey’s Local Elections of 2009: Winners and Losers,” pp. 1-18.
- A similar argument could also be made about the CHP organization. However, the dynamics that shape the renewal of the CHP organization is very different from that effective for the AKP. Nevertheless, new parliamentarian elite within the CHP could potentially lead to a renewed dynamism in the opposition. Yet this will have to be tested in time.
