
Introduction
Oil is considered the world economy’s bloodline. It is both an indicator and the determinant of economic growth. It is a curse and a necessity blended into a single commodity. It is a source of evil and a source of good, as prices oscillate between peaks and pits, providing new insights in every cycle. Oil price hikes and crashes are different every time and rarely anyone predicts a hike or a crash with correct timing. For the experts “it is different this time,” for the ignorant “it was obvious”. This eccentric nature of oil dynamics is the subject of thousands of studies. Still this very commodity is the quintessential example for those seeking to understand complex interactions between economy, finance, and geopolitics.
The subject is “as deep as the rabbit hole goes.” But there is a possibility for abstraction. Through this process I will try to subset the major determinants of oil prices in four categories. These four categories are technology, economy, fear, and temporal effects. In this article, these relations will be explained and a methodology for understanding world oil price dynamics will be presented. Within this framework, major indicators for price movements will be listed. Financial and economic effects will be further elaborated followed by the geopolitical perspectives and consequences. In the last part, “predictions” for what type of future crises will occur and opportunities stemming from oil price movements and levels will be outlined. In summary, the story and future of the complexity of oil price developments is told through an analytical framework by using the system dynamics approach.
Just before the drop of oil prices, Iraqi oil production was disrupted and was priced as a level shifter
Theoretical and Conceptual Framework
An important aspect of oil prices is the influence of the “paper oil,” or the so-called energy futures market. Especially, in explaining the “2008 Oil Bubble” (2008 bubble), one credible theory is the “phenomenal increase in financialization of commodity markets during 2006-2008.”1 However, the discussion has two sides. One group claims that the “oil price peak in 2008 was pure speculation.”2 The other side claims that there is not enough evidence to prove that speculation was the major driver for prices. The explanation for the 2008 bubble is said to rest on fundamentals, meaning oil market fundamentals. Oil market fundamentals, at the time, indicated a growing demand from China and emerging economies, a decrease in producer countries, and no new resources or technology on the horizon.
During that time one popular stream of semi-ideological theory was the “Peak Oil Theory.” “Peak Oil” is a theory based on M. King Hubbert’s idea that there is a point in time when the maximum rate of extraction of petroleum is reached, after which the rate of production is expected to enter terminal decline. The proof is illustrated in his paper “Nuclear Energy and Fossil Fuels” where Hubbert correctly predicted the decline of U.S. crude oil production.3 Peak oil advocates assume the world oil reserves, as a stock or a tank. In the first 50 percent of this stock, production will be mostly from “low hanging fruits.” But as stock nears 50 percent, production will be harder and more expensive. Hence, as the level of tank drops below 50 percent of its full capacity the oil production will start to drop dramatically. The theory does not consider improvements in technology or new kinds of resources. The reasons why Peak Oil Theory is important is that it triggered the fear that world oil production cannot cope with the growing demand, especially from China during 2000-2008. This fear may have helped both speculators and green movements. The arguments associated with Peak Oil Theory are generally fundamentals (supply, demand, geology etc.), but not all members of the “Fundamental Camp” associate themselves with Peak Oil Theory advocates. According to the Saudis, this “fear factor” has played into the hands of speculators.
WikiLeaks cables show that during the most heated times of the 2008 bubble, May 2008, U.S. officials asked the Saudis to increase production. According to documents, Prince Abdulaziz bin Salman bin Abdulaziz al-Saud said, “[Saudi] Aramco is trying to sell more, but frankly there are no buyers… We are discounting buyers.”4 During the meetings “Saudi officials explained that they have two primary concerns about artificially high crude prices: that they’ll dampen the long-term demand for oil and the wide price swings typical of commodity speculation make it difficult for them to plan future oil field development.”
However, the naysayers of the discussion claim that the analytical evidence is not obvious. Research based on a comprehensive dataset of individual positions in the most liquid U.S. futures markets for energy and equities (S&P 500 e-Mini), which is maintained by the U.S. Commodity Futures Trading Commission (CFTC), argues that “it is not simply changes in overall energy speculation that help forecast the observed correlations.”5 The real link that looks like a correlation between speculation and oil prices are most likely hedge funds. And according to the article, hedge funds lose their “informativeness” during the periods of elevated financial market stress. One fundamental argument is the relation between the spare capacity and spot price. It is expected that as the market has more spare capacity, spot prices should be less volatile, but when the spare capacity hovers around the margins the prices skyrocket.
One has to understand that if there is no new capacity entering into the market, the production costs would only shoot up to the marginal barrel that is produced. The question is how the price reached 140 dollars when the marginal cost of a barrel was around 70 dollars, according to International Energy Agencies World Energy Outlook reports for the years 2005, 2006, and 2007. One reason, according to a report by the Baker Institute for Public Policy, is the Commodities Futures Modernization Act of 2000 by the Clinton Administration, which “effectively cleared the way for more lax regulation of new oil risk management products”6 that feed the fire of speculation. The real divergence between the two camps is not the “Fundamentals.” They all agree that fundamentals have a part in the 2008 bubble. But the main divergence is whether it is a “causation or correlation.”
Fast forwarding to the recent oil price crash, John Kemp from Reuters claims and provides evidence about the relationship between hedge funds’ positions and oil prices. His “Fundamentals” are U.S. crude stocks and a number of rigs. Long (the holder of the position will profit if the price of the security goes up) to short positions (the holder of the position will profit if the price of the security goes down) have reached their lowest level in four and a half years.7 That is to say that most of the money managers bet their money on decreasing oil prices. In the literature one can find both views supporting each side of the discussion. Is it the hedge funds that cause speculation, or pricing of “Fundamentals” by these funds? Nevertheless, a pragmatic view-point would be to watch net long and short positions in the paper markets to improve the forecasting of the trends in oil prices.
Geopolitics
One fear element in oil prices is geopolitics. Whether it is an attack or possibility of an attack to the infrastructure or an improving relationship between Iran and the west or sanctions, the pricing of such events is complex. The effect, the duration, the proximity of tensions to the major oil fields and refineries as well as the share of mentioned countries in the world oil exports are important parameters to consider.
The price movements between July 2014 and January 2015 reflect these trends. Examining this period, the prices are a consequence of the “potential disruption” in Russian oil/gas exports due to sanctions but no major disruptions actually occurred. Still there remains the risk of potential technical equipment shortages for Russian firms, which could impact Russian oil production. Just before the drop of oil prices, Iraqi oil production was disrupted and was priced as a level shifter. However, the prospect of improving conditions in Iraq and Libya to increase oil production initiated the downward slide in oil prices. Global economic prospects, U.S. production, and OPEC’s failed attempts to control oil prices accelerated the slide.
The dependence on Middle East oil will shift to China from western countries
As described at the outset of this article, oil prices are priced by factors and temporal perceptions. Oil prices fluctuate with “potential” events but also these same events can impact future prices. In the world of oil market pricing, the reality of today’s well or refinery current production could be affected by future outcomes. Tomorrow’s probabilities define the present in this volatile industry. A recent example is the U.S.-Iran Nuclear Deal. Although the sanctions will not be lifted before January 2016, oil prices dropped on the day the agreement was reached.
Attacks on oil refinery or pipeline infrastructure are another geopolitical factor often causing oil prices to jump. Generally, they are not perceived as a “big” surprise by markets but their impacts are immediately visible. However there are outliers. There are other events that slowly unfold with unexpected developments, such as the Nigerian elections and the tensions it created within that country. One such event is the explosion on the Turkish part of BTC pipeline before the 2008 Georgian-Russian war. There is plenty of speculation related to this explosion, particularly, because there may have been a cyber attack component. Bloomberg claims, “hackers had shut down alarms, cut off communications and super-pressurized the crude oil in the line, according to four people familiar with the incident… The main weapon at valve station 30 on Aug 5, 2008 was a keyboard.”8 If true, such an attack incorporates multiple dimensions and several geopolitical consequences, which marks a new era of oil security, geopolitics, and cyber-security. The PKK never mentioned the cyber side of this attack.
These types of crises follow patterns. The Worldwide Incidents Tracking System used to have records of such incidents until its discontinuation in April 2012. However, an article, from June 2011, investigates and analyzes the nature of these attacks on energy infrastructures.9 Infrastructure attacks also seem to follow seasonal patterns. Pipeline attacks appear to follow a pattern where they peak during the months of January, February, and then in July. Oil related attacks peak during May, June, and July. Iraq and Nigeria were at the forefront of such attacks. Natural gas infrastructures were also the targets of these types of attacks.
There are also expected differences between a war and a terrorist incident in terms of effects. For example “wars may predispose investors and market agents for more profound and longer lasting effects. On the other hand, in the case of terrorist incidents that, vis-à-vis war are of a more transitory nature and one-off security shocks….”10 It also depends on the liquidity of the markets and the volume affected. Based on the research, one can argue that certain markets (S&P, FTS, etc.) are more efficient in absorbing the impact of terrorist attacks.
Another finding articulates that “if two criteria are met, conflict can positively affect an oil company’s stock price. First, oil firms must have some monopoly power. Second, the informational content of a terrorist or conflict event must be large enough to seriously affect investor perception of the market. […] in the current era, as cartel behavior of OPEC member countries has diminished and as conflict has become more regular, thus, the information surrounding it noised (not clear), oil prices do not increase in response to conflict.”11
But oil prices and new oil resources can change geopolitical strategies. As the U.S. extracts huge oil resources from domestic shale basins and declares its energy independence, regional strategies are no longer necessarily linked to a politically unstable Middle East.12 This also changes the landscape of conflicts, as the U.S. does not appear to have made the resolution that regional conflicts in the Middle East are its priority. If the prices get higher, more shale resources (and non conventional fossil fuels) from the U.S., China, and other countries (maybe Europe) will be economical, so reliance on Middle East oil will decrease further. But that does not mean dependence on Middle Eastern oil will end. It implies that the dependence on Middle East oil will shift to China from western countries. Consequently, the geopolitical priorities and the prioritization of conflicts (ethnical violence-terrorism vs maritime disputes-control of chokepoints and routes) may change.
As geopolitical events have multiple facets, they also have many consequences. First, the impact of the crisis on the markets has to be assessed. Second, will this affect the liquidity of the market? Third, if the event (such as war) is expected to be ongoing what would the lasting effects be? Finally, how geopolitical strategies interact with oil prices have to be considered.
Traders, Markets and Fear
When an expert claims to forecast the future of oil prices, he attracts a substantial amount of skeptical critics. Econometric models are not reliable for the long-term, neither are complex models like artificial neural networks, nor are other “exotic” algorithms useful, as it appears that randomness is an essential component of price fluctuations. Oil prices are the result of complex interactions between a number of parameters. There may be a dominant factor that explains the impact while at other times it is a combination of several events that have occurred or have an unknown probability to take place. And all these parameters are priced by thousands of traders around the world differently. The resulting price can be attributed to “chaotic interactions of perceptions on valuations.”
Saudi Arabia has a valid explanation for its discount in oil prices in order to maintain its dominance in the Asian energy market
However, one can never claim that oil prices are free from manipulation and subject to pure randomness. A careful analyst should not always associate price movements to specific geopolitical tensions, it may be a technical maneuver played by the traders. In 2013, a trader explained his technique to manipulate the price methodology that determines major oil prices.13 To buy oil at a lower price, he first sells small amounts at a discount and reports these prices to Platts, a major price reporting agency. As the agency calculates lower prices through its methodology, now the prices are lower than the initial trade. The trader then buys large chunks of the commodity at a discount he achieved. This process is only a single example of a price movement free from financial and geopolitical perspectives. It is just a price manipulation exploiting a reporting methodology.
These kinds of tactics may be widespread among the trader community. Further, they have unique and interesting methods to communicate with each other. Most of these traders do not use Twitter or Facebook as their choice of social media for communicating. Although it sounds absurd in the age of WhatsApp, Yahoo messenger, which is one the first messenger services launched 20 years ago, is the main messaging application for oil traders. 14
Traders are the first level of actors in the oil price market. At the next level, one should also consider how traders are also representing the interests of major banks or companies they are related to. Industry experts argue that some traders, working closely with major oil producing countries, also affect the prices in favor of those countries’ strategies. Although there is no solid evidence for such arguments, in February 2015, Igor Sechin, head of Russian Energy giant Rosneft claimed that “energy markets are being manipulated by a powerful alliance of forces, from Washington to Riyadh and Vienna, which present a long-term risk to the global economy.”15
However, Saudi Arabia has a valid explanation for its discount in oil prices in order to maintain its dominance in the Asian energy market.16 Accordingly, Asia accounted for 65 percent of Saudi crude exports in 2014 compared to 2006. However, in recent years Iraq has emerged as a major challenger for Saudi shares in those markets. But the whole issue can be divided into a buyer’s (consumer) or seller’s (producer) market. A buyer’s market is where the supply is greater than demand; hence, the buyer can dictate the price, while the seller’s market is the opposite. So, it is easy to comprehend that if there is a high level of supply (oil) in the market, sellers have to compete with each other to preserve their market share, if the market is competitive.
Another important factor is “fear,” which has been seen as the major reason for record oil prices in 2008. It was also the reason for why oil prices reached a plateau between 2011-2014 due to the Arab Spring and tensions in the Middle East. As The Economist claims “Two factors determine the price of a barrel of oil: the fundamental laws of supply and demand, and naked fear.”17 Interestingly, the article claims that Libya was one of the main actors to cause price spikes in 2011. The same country has been singled out as the main reason for starting the chain of events that led to the oil price crash from 110 $ per barrel to 55 $ per barrel in the second half of 2014.
For some experts this all boils down to the “shale revolution,” where the U.S. became a major producer for crude oil through a series of technologies, for example fracking and horizontal drilling, which enables shale resources to be extracted. However, no one seems to claim the renewable revolution led by Germany as the evil behind such price drops. The foremost reason could be that the renewable revolution rests on governments’ -higher than market price- feed in tariff guarantees.
Renewables do not create a market surplus in the oil market, at least not in the short-term. It is a known but underutilized resource called shale that is the prime suspect for the recent market turmoil. The dynamic relationship between market surplus and oil prices is strong. The shale revolution (in the graph referred to as “tight oil”) has lately dampened the prices by providing extra surplus capacity to the global oil supply.
System Dynamics: Three Parameters and Temporal Effects
System Dynamics “is a perspective and set of conceptual tools that enable us to understand the structure and dynamics of complex systems.”18 Oil price dynamics is well-suited for a system dynamics case study. In system dynamics, it is not the primary relationship that defines system properties alone, but diagrams and tools that illustrate the secondary and tertiary effects. The major system elements defining the oil price oscillations are technology, economics, and fear. These three dimensions are bounded by temporal (future expectations and present assessments) perceptions. In each parameter, the effects are different for supply and demand, where traders are the agents that evaluate the impact of such parameters instantaneously (or close to real time). They also value the oil relative to exchange rates and the values of other commodities such as gold, silver, etc.
Figure 1. System Dynamics of Oil Price Dynamics

The figure above starts with technology followed by economics, and fear. Technology is the main parameter since energy is always associated with a technology in order to be utilized. This utilization produces an economic activity or necessitated by economic activities. In addition, there is a behavioral aspect throwing off these mechanics. All these factors are two sided: supply and demand. While consumers can get more efficient, so does the oil production. Economics may provide more credit to new oil producers or it may decrease consumption due to high prices. Fear is a human element that may be associated with all parameters but the parameters portrayed above are sufficient for the purpose of this analysis.
The foremost factor is technology. Oil is not a recent invention. Its properties have been well known for centuries. According to the Old Testament “Noah’s Ark” was pitched with bitumen.19 Oil was the secret ingredient of “Greek fire.”20 However, the real commoditization of crude oil started with refining technology, as it allowed the production of a much higher quality product; “rock oil” replaced sperm whale oil for illumination. Since the beginning of the 20th century, when the internal combustion engine was invented, oil became the enabler for mobilization.
Technology and the resource relationship are like the chicken and egg problem. One thing leads to progress in the other one. For example, higher oil prices paved the way for large-scale commercialization of shale technologies, which facilitated the use of shale resources. As more gas is produced, the infrastructure for natural gas vehicles and substitution of coal plants with gas plants increased. On the other hand, technology has different effects on the demand side, as engines became more efficient demand growth began to stagnate in OECD countries. Also as oil became more expensive, electric and hybrid cars gained more attention. Within such a high priced and volatile environment consumers are either trying to limit or balance price effects in their budgets or invest in new technologies to mitigate uncertainty.
If oil prices look as if they will stabilize at certain price levels, it is easier to find credit for new projects for offshore drilling or oil sands
Economics is the major driver of oil supply and demand. Economic growth, credit opportunities, and consumer prospects are the key drivers of this parameter. As the economies of the world or at least the major ones grow, producers gain an advantage over consumers. However, long years of stagnation or economic crises quickly impact the incomes of sellers as demand for their products slow down and stagnate. The consumers also readjust their budgets through substitution or savings. If oil prices look as if they will stabilize at certain price levels, it is easier to find credit for new projects for offshore drilling or oil sands, since both banks and investors interpret the stability as security. Volatility scares everyone except for short-term traders. Investments stagnate until predictability increases.
As mentioned above, the “fear” parameter is no stranger to oil markets. In 2008, it was the fear of peak oil mixed with the growing demand from emerging markets. It was not a conflict per se. However, in the past, peak prices concurred with geopolitical events. The Arab oil embargo of 1972, the Iranian revolution in 1978, and Saddam Hussein’s invasion of Kuwait in 1990 are examples of major disruptions on the supply side. However, on the demand side, employment and recession fears are dominant. Although they are economic parameters, the fear of increased unemployment and a possible fear of a recession have far reaching effects, greater than most of the fundamental factors.
Then comes the question of the value of oil. Oil is denominated in U.S. dollars around the world. Furthermore, different oil blends are priced according to major oil blends, such as WTI and Brent. The value of oil is determined in the global markets. The assessment of traders also incorporates exchange rate fluctuations as well as the relative value of other commodities. The U.S Energy Information Administration, from time to time, publishes the commodity correlation maps, where the direction and strength of correlations between commodity prices are presented. For example, during liquidity expansions gold, oil, and other metals move together, whereas the U.S. dollar moves in an opposite direction but with relative strength.21
The temporal effects of these parameters are also non linear. For example, an agreement with Iran is good news and lets the price discount immediately for a bit, although the real impact of such a deal needs at least 2-3 months to physically affect oil markets. The name given to such action is “buying forward;” in other terms pricing a future event. Most of the parameters that impact oil prices occur with a delay. Monthly data is published at least 15 days after the last day of the relevant month. There are also temporal differences in publication periods between parameters, such as weekly oil stock levels, monthly car sales, and quarterly economic growth. All these parameters are a summary of a past period. Traders assess the future prices depending on the published data and reflect them on to the spot prices. For example, if stock levels in the U.S. are increasing, there will be an expectation that there will be a surplus in the future, so this surplus is priced into the spot prices.
Figure 2. Temporal Effects of Events on Oil Prices
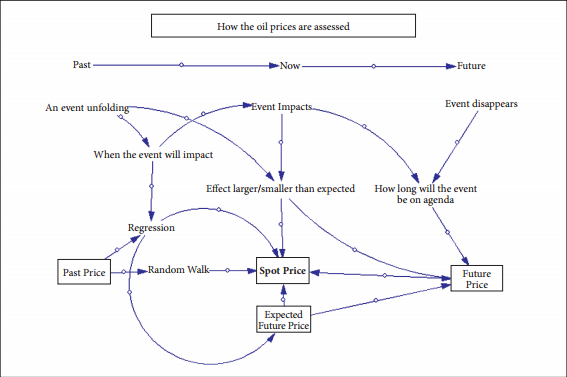
The figure above displays such a relationship. As an event unfolds in the past, it can already start to impact today’s prices. Mathematically today’s prices is a “random walk” (a random distance) away from a past price. But as more information is gathered the initial assumption is corrected by recent information. Then this information projects the effect of the price into the future. Let’s assume that there is ongoing sectarian violence in Iraq. There is a possibility that there may be an attack on major energy infrastructures. Despite the fact that such an event has not happened yet, the possibility is priced with a risk premium.
The commodity indexes can give insights about whether the price movements are due to an expanding economy or oil dynamics
Generally the expectations for the current prices resemble a linear regression of recent prices, however, there is always unpredictability associated with pricing. Mathematical models suggest the “best bet for tomorrow’s oil price is today’s price.” Generally, oil prices are not linearly correlated with the past prices but happen to be a random walk away from the previous price. As events occur, the new pricing is based on the risk premium previously incorporated in to the previous price, plus or minus the value associated to the difference between reality and expectation. So, oil prices increase as instability in Iraq increases. But if the insurgency fails to extend its gains as expected, then the risk premium previously priced to the value is eased. During that time, it is possible that no infrastructure may have been damaged. One can contemplate the same events in the case of Nigeria or in the regions held by ISIS, etc.
The current risk premium also affects future prices as long as the life cycle of the event continues. Expecting that the events will persist for some time –instead of selling cheap and buying expensive later- the current prices integrate future “fears.” Future price (future price means future price in future markets) is a function of spot price and an expected event horizon (event duration) of other events. But events that are hard to foresee (For example: 9/11 was an event that was not predicted and therefore could not be priced in advance.) are shocks to the system. Shocks are events where the time span between the actual event and its impact is quite short. As an event disappears, the price impact also disappears. An example would be the oil price peak of 2008, where as the economic growth is replaced by the fear of global recession, the trend in oil prices changed dramatically. To be able to scrutinize this theory further we have to look more deeply in to the major indicators that have an impact.
Indicators
The indicators for price movements are listed from the less known ones to the more well-known ones. These indicators generally work in combination, so, it is difficult to isolate and quantify the impact of a sole indicator or factor on a price movement. For example, one indicator could be the commodity movements or one factor may dominate other ones, like surplus capacity, or another factor could be the value of the dollar at that time. Indicators and factors are multiplied in combination with other indicators.
Indicator 1: Value of the Dollar
The most objective criteria to understand oil price movements is to look at how the U.S. dollar is valued against other commodities or with respect to different time periods. As a simplification to demonstrate this, when prices were hovering around 110$ per barrel in the first half of 2014, the U.S. dollar index was slightly higher than 80$.22 However, as the oil price moved to 55$ per barrel, the dollar index had reached 100s. A 25 percent increase in the value of the dollar means, setting aside all major factors, the price of oil should be 82.5$ at most instead of 110$ if the dollar index is an indicator, ceteris paribus.
Indicator 2: Commodity Indexes and Relation to Other Commodities
How oil moves with respect to other commodities is also another explanatory variable. There is a commodity index called CRB (Commodity Research Bureau) to assess how a basket of commodities is behaving. The commodity indexes can give insights about whether the price movements are due to an expanding economy or oil dynamics. As seen from CRB movements,23 after 2009, oil prices became less correlated with other commodities for sometime. This can be explained by a weakened demand in oil relative to other commodities. But between 2001-2008, the price of other commodities was quite closely associated to the price of oil. It is attributed to the monetary expansion of the U.S. dollar, where money flowed to the commodity markets for investment purposes.
Indicator 3: Storage Levels
Storage levels need careful scrutiny, because as oil prices drop and there is an expectation that prices will rise in the future, investors put more oil into storage. However, storage levels also increase as supply surpasses demand. The financial crises in 2008 pushed the traders to store oil instead of trading, where as in the late 2012 storage in Cushing, Oklahoma reached record highs due to transportation constraints.24 Recently, low prices are driving an inventory built up.
Indicator 4: Seasonal Patterns
Seasonal patterns are an important driver for oil prices. One major pattern is the U.S. driving season starting from early April to the end of August, as drivers increase their mobility, hence, gasoline consumption. Also heating oil consumption starts to increase by the end of autumn.25 However, driving season is the most well known of these patterns.
Indicator 5: Vehicle Miles Traveled, (Type of) Car Sales and Composition
Although high oil prices push for more consumer efficiency, the “stickiness” (persistence) of such effects is disputable. After the collapse of oil prices in the second half of 2014, EV sales started to stagnate and later decreased further while SUV sales increased.26 Not only was there a structural change in the car market but lower oil prices encouraged customers to buy larger engine vehicles. In addition, because of this drop in oil prices the total amount of vehicle miles driven also increased to record highs, as consumers started to use their cars more. This further affected oil prices and their prospects.
Indicator 6: Rig Data
Bakker Hughes oil rig data has been the most popular indicator for predicting U.S. supply. However, one should be cautious with this data. There are two facets to rig data. The first one is the change in technology from 2007 to 2015 where the multiple vertical wells were replaced by a single horizontal well as shale technology has progressed. The other one is, as oil prices slide to lower levels, producers close their wells or suspend the development of drilled ones. The closing of the wells only explains the economics of production. These closed wells will not produce for sometime, but the resources will be there and as the break -even point is reached these wells will be producing again. There is one other aspect that rig data does not cover- it is the increase in productivity per well. Therefore, from time to time just considering rig data can be deceptive; oil production per well data should complement the analysis.27
Indicator 7: Spare Capacity
A very important parameter influencing oil prices is the spare capacity data. Some analysts distinguish between non-Saudi or sometimes non-OPEC capacity and global spare capacity, since OPEC capacity is considered static, whereas capacity additions more frequently come from non-OPEC countries. This indicator helps the analysts to consider how the demand and supply balance is shaping and will be shaped. Spare capacity is the most famous oil price “fundamental.” For practical purposes, around 2-2.5 million barrels per day spare capacity dampens the volatility of markets. This number comes from the bull market between 2003-2008, where the spare capacity dropped below 2 million barrels per day. It was also a major concern that this capacity was only available from Saudi Arabian wells.
Indicator 8: Global Oil Demand
Global oil demand growth with respect to previous months and especially a previous year’s same month is an important indicator for oil prices. Nowadays, Asian countries, and in particular China, are considered the major drivers of global oil demand. Therefore, global demand should be separated from Asian demand growth. In particular, Chinese demand is an indicator to be carefully watched.28
Indicator 9: Oil Supply
World oil supply is another fundamental in oil price movements; however, data reliability is lower than others. For example, for OPEC quotas, most traders suspect that countries do not stick within the agreed production targets. Another important issue is that oil production in producer countries is defined by the targets of governments. That means, if prices go lower than targeted levels, OPEC countries tend to produce more to reach budget targets, hence, accelerate the downfall. Oil supply and spare capacity are frequently discussed and criticized among sector professionals. Sometimes a supply figure reported can be a transfer to the producer country’s own oil tankers. For both parameters, IEA’s monthly Oil Market Report and www.jodidb.org are well known reference points.
Today, the last citadel of oil, namely transportation, is under threat from electric battery technology and natural gas vehicles
Indicator 10: Competition
The latest lesson of the oil market dynamics is that the race for preserving market shares can be quite brutal. Between 2002-2008, the competition was among buyers, as they tried to secure more oil for their economic growth. However, market surplus played in to the hands of buyers in the last 3 years. The main reason of the recent collapse is how major producers compete for emerging markets. Since 2014, Saudi Arabia has begun to lose its shares both in the U.S. (due to U.S. production growth) and in China (since both Iraq and Latin American producers target Asia). This ignited heated competition where sellers discounted their prices for Asian markets. Saudi Arabia follows a certain rational in such a competition since its costs are the lowest. So, it is pushing other producers to such low profit margins that they cannot sustain this type of competition.
Forecasting the Next Crises
Recently, the relative stability and softening in oil prices are connected to two main parameters: mixed signals coming from the global economy and U.S. shale production (tight oil etc). But this does not need to be the case forever. The 2008 bubble happened when the global economy was very healthy and prospects were bright. The expectation for oil demand growth to continue due to China and non-OECD countries was regarded as the demand side motivators, whereas diminishing spare capacity on the supply side was the catalyzer.
On the other hand, sustained high prices impacted the economies and changed them structurally. Today, national economies are less energy intensive than in the 1970s or 1980s. There is a recurring theme in energy resource usage: Sustained high prices improve the chances of finding and using alternative energy resources through technological developments. Further, if these alternative resources reach a certain threshold (scale economics) they can start to take a bite out of the market shares of the dominant resource. A comparison would be how sperm whale oil was replaced by rock oil (petroleum), as the whale population decreased and prices peaked. Or, for example, when timber was replaced by concrete, steel, and other technologies to replace wood. The stone-age didn’t end because we ran out of stones. Man evolved and so did our economy through improvements in technology.
High prices for prolonged times increases short-term profits but diminished long-term gains and reduces the producer countries’ impact on global politics and economics
Following oil price peaks in the 1970s and 1980s, oil consumption has been locked into the transport sector and has retreated from all other major industrial sectors, including power generation. But today, the last citadel of oil, namely transportation, is under threat from electric battery technology and natural gas vehicles (mainly for freight). However, until that time arrives, oil prices need to stay higher for a sustained period to enable more research and development in alternative energy technologies under the principle of economy of scales.
With all this information, the next oil price crises should be at the junction of not just one but several factors: (i) Global or major economies should be in a healthy economic environment with good growth prospects; (i) global crude oil spare capacity should be in a declining trend or must be stagnant for some time; (iii) there should be no new technologies in the pipeline that meets the economic criteria; (iv) for positive oil price shocks, the shock must be on the supply side (disruption) and for the negative price shocks the event must be on the demand side (such as a major recession).
But having said that, there are also events that may have triggered the next crises but may need sometime to unfold. To occur it needs a sustained period of low oil prices. Within this perspective the components of “distant crises” are as follows: Distorted budgets of the producing countries (such as recent developments in Venezuela), prolonged recessions (EU), deteriorating investment environment for the oil sector, ecological disasters to block oil developments, increased terrorist activities in the major non-OECD oil producers (maybe due to low prices), and the failure to contain Middle Eastern crises.
But for these developments to happen shocks are not enough. These developments and their aftermath would have to persist for more than 2 years, where the long-term effects must be visible. Low oil prices are not necessarily dangerous for oil producers; they have funds or security infrastructure to provide stability. However, low oil prices for a sustained period are dangerous. These oil producers’ economies are reliant on oil revenues. Diversification of economies away from oil rents is a slow and meticulous process since economical adjustments need time.
In terms of practical examples, here are a list of causes/triggers for possible positive/negative oil price shocks categorized according to technology, econoy, and fear (no particular order).
1. Technology:
a. Electric battery technology breakthrough,
b. Natural gas vehicle technology abundant and cheap,
c. Self-driving cars (will increase mobility and energy consumption),
d. Robotics and drone technology (will decrease employment),
e. Efficiency and new materials,
2. Economic
a. Chinese economic prospects (positive/negative),
b. Bankruptcies in the U.S. oil sector, or credit related issues impacting banks,
c. Growth prospects in emerging economies,
d. Budget problems in oil producing countries,
e. The decision to hold 90 days oil stocks among non OECD countries,
3. Fear
a. Sectarian conflicts in the Middle East,
b. Greek exit from the Euro Zone,
c. Prolonged recession in China, the EU, or another major economy,
d. Pervasive public unrests (such as Arab Spring),
e. Growing Nationalist Movements.
Among producers there are three major countries to watch for the next crises: Russia, Saudi Arabia, and USA. Russian oil production crashed after the break up of the Soviet-Union. A major crisis in Saudi Arabia could be much more complicated based on the region of the conflict as well as the scale. On the U.S. side, the problem can be completely different since producers may find it hard to pay their debts to financial sector in a low oil price environment. There are other secondary countries such as Iraq, Iran, Libya, and Nigeria that are on the list of countries where political turmoil is rampant. However, traders already consider these countries as the “usual suspects.” Thus, the “surprise effect” is associated with Russia or Saudi Arabia for the supply side and China for the demand side.
Whatever happens, oil producers have learned an important lesson, which should be examined by natural gas producers. High prices for prolonged times increases short-term profits but diminished long-term gains and reduces the producer countries’ impact on global politics and economics. Every oil price peak is another nail in the coffin of oil. It will stay important, but its heyday may be over. Still, compared to other fossil fuels, like coal and natural gas, it remains at the top three energy resources consumed
The wise words of the late Rashid bin Said al-Maktum, the Vice-President of United Arab Emirates, should help us contemplate the future of oil producers instead of oil itself: “My grandfather rode a camel, my father rode a camel, I drive a Mercedes, my son drives a Land Rover, his son will drive a Land Rover, but his son will ride a camel.”29
Conclusion
Oil prices are not like other commodity prices. They influence nearly all fossil fuel prices, which are necessary for our modern lifestyle. But this influence is not easy to understand. In this article an abstraction with four sets (economy, technology, fear, and temporal relations) and fundamental indicators is presented. These abstractions are used to analyze and understand recent events through specific examples and projecting forecasts Just like draft map projecting a geography.
The main motivation in writing this article is to give a structured high-level insight to the formation and implications of oil prices. Anyone can comment on oil price movements due to geopolitical factors, economic prospects, and panic in the markets or future expectations. By combining practical examples with a simplified level of abstraction, this article will –hopefully- help the lay reader to categorize, reason, and interrelate different factors’ effect on oil prices. In the future, these dynamic effects will surely evolve, but from the abstraction level I presented, it is my hope that a better understanding of the movements of oils prices can be garnered. To simplify the theoretical framework further, the temporal relations are illustrated by model and graph techniques.
At the end of the day, oil prices are a single 2 or 3 digit indicator for many things. How such a vast amount of information, perception, and relationships end up with a single number may remain partially unsolved. However, a structured understanding will improve the prospects for reliable forecasts or scenario studies.
A concluding message on oil prices should start with a famous quote from United States Secretary of Defense Donald Rumsfeld: “… there are known knowns; there are things we know we know. We also know there are known unknowns; that is to say we know there are some things we do not know. But there are also unknown unknowns – the ones we don’t know we don’t know.” And it is best to remind ourselves that humility is not a merit but a requirement when it comes to the complex world of “knowns” and “unknowns”. Oil prices are teaching us new “knowns” and “unknowns” every time they dip or peak. We should better be a humble student who is trying to get ready for the next lecture while reviewing past lectures.
Endnotes
- Mohsin S. Khan, “Policy Brief: The 2008 Oil Price Bubble,” Peterson Institute for International Economics, (August 2009), retrieved April 4, 2015, from http://www.iie.com/publications/pb/pb09-19.pdf
- F. William Engdahl, “Perhaps 60% of Today’s Oil Price is Pure Speculation,” Global Research - Centre for Research on Globalization, (2015), retrieved April 4, 2015, from http://www.globalresearch.ca/perhaps-60-of-today-s-oil-price-is-pure-speculation/8878
- M. King Hubbert, “Nuclear Energy and The Fossil Fuels,” Shell Development Company Exploration and Production Research Division, (June 1956), retrieved June 17,2015, from http://www.hubbertpeak.com/hubbert/1956/1956.pdf
- Kevin G. Hall, “WikiLeaks: Saudis Often Warned U.S. About Oil Speculators,” McClatchy DC., (2015), retrieved April 4, 2015, from http://www.mcclatchydc.com/2011/05/25/114759/wikileaks-saudis-often-warned.html
- Bahattin Büyükşahin and Michel A. Robe, “Does Paper Oil Matter?,” Bank of Canada, (February 23, 2014), retrieved April 4, 2015, from http://www.bankofcanada.ca/wp-content/uploads/2014/07/bahattin-buyuksahin.pdf
- Kenneth B Medlock and Jaffe, Amy Myers, “Who is in the Oil Futures Market and How Has It Changed?,” (August 2009), retrieved April 4, 2015, from http://www.rice.edu/nationalmedia/multimedia/2009-08-27-speculators.pdf
- John Kemp, “COLUMN-Hedge Funds Get Short of U.S. Oil as Storage Fills,” (March 23, 2015),
retrieved April 4, 2015, from http://www.reuters.com/article/2015/03/23/hedgefunds-crude-usa-
kemp-idUSL6N0WP2CW20150323 - Jordan Robertson and Michael A Riley, “Mysterious ’08 Turkey Pipeline Blast Opened New Cyberwar,” Bloomberg, (December 10, 204), retrieved April 5, 2015, from http://www.bloomberg.com/news/articles/2014-12-10/mysterious-08-turkey-pipeline-blast-opened-new-cyberwar
- Barış Sanlı, “Terör Olayları ve Enerji Zinciri,” (June 2011), retrieved April 5, 2015, from http://www.barissanli.com/calismalar/2011/BSANLI-Haz2011-TerorOlaylariVeEnerjiZinciri-sonhali.pdf
- Christos Kollias, Catherine Kyrtsou and Stephanos Papadamou, “The Effects of Terrorism and War on the Oil and Prices - Stock Indices Relationship,” Economics of Security, Working Paper 57, (November 2011), retrieved April 5, 2015, from http://www.diw.de/documents/publikationen/73/diw_01.c.391361.de/diw_econsec0057.pdf
- S. Brock Blomberg, Gregory D. Hess and Hunter Jackson, “Terrorism and the Returns to Oil,” Robert Day School of Economics and Finance Research, Paper No. 2008-12, (June 17, 2008).
- Terry Macalister, “Low Oil Price Means High Anxiety for OPEC as US Flexes Its Muscles,” The Guardian, (2015), retrieved April 5, 2015, from http://www.theguardian.com/business/2014/oct/19/oil-price-us-opec-brinkmanship-shale-gas
- Justin Scheck and Jenny Gross, “Traders Try to Game Platts Oil-Price Benchmarks,” (2015), retrieved April 12, 2015, from http://www.wsj.com/articles/SB10001424127887324682204578517064053636892
- Cassie Werber, “Oil Traders in Europe are Amazingly Still Addicted to Yahoo Instant Messenger,”
Quartz, (2015), retrieved April 12, 2015, from http://qz.com/321355/oil-traders-in-europe-are-
amazingly-still-addicted-to-yahoo-instant-messenger/ - Andrew Critchlow, “Rigged, Manipulated and Opaque: The $3 Trillion Oil Market Needs Reform,”
Daily Telegraph, (2015), retrieved April 12, 2015, from http://www.telegraph.co.uk/finance/newsbysector/energy/oilandgas/11414680/Rigged-manipulated-and-opaque-the-3trillion-oil-market-needs-reform.html - Bassam Fattouh, “Oil Market Dynamics: Saudi Arabia Oil Policies and US Shale Supply Response,” The Oxford Institute for Energy Studies, (March 18, 2014), retrieved July 17, 2015 from http://www.oxfordenergy.org/wpcms/wp-content/uploads/2015/03/Oil-Market-Dynamics-Saudi-Arabia-Oil-Policies-and-US-Shale-Supply-Response-.pdf
- “Oil Markets and Arab Unrest: The Price of Fear,” The Economist, (2015), retrieved April 12, 2015,
from http://www.economist.com/node/18285768 - John D. Sterman, “Business Dynamics: Systems Thinking and Modeling for a Complex World,”
(Irwin McGraw Hill, Boston, MA, 2001). - Institute for Biblical & Scientific Studies, “Genesis: Genesis 6-9 Noah’s Flood,” (2015), retrieved April 12, 2015, from http://www.bibleandscience.com/bible/books/genesis/flood.htm
- Alex Roland, “Secrecy, Technology and War: Greek Fire and the Defense of Byzantium 678-1204,” Technology and Culture, Vol. 33, No. 4 (October, 1992), pp. 655-679.
- Energy Information Administration, “What Drives Crude Oil Prices? An Analysis of 7 Factors That Influence Oil Markets, with Chart Data Updated Monthly and Quarterly,” (2015), retrieved April 12,
2015, from http://www.eia.gov/finance/markets/reports_presentations/eia_what_drives_crude_oil_prices.pdf - “US Dollar Index Futures – Data,” Quandl, (2015), retrieved April 13, 2015, from https://www.quandl.com/c/futures/ice-us-dollar-index-futures
- Capital Investment Services, “BRIC Markets Results = Lower Commodity Prices,” Capital Investment,
(2015), retrieved April 13, 2015, from http://www.capinv.com/bric-markets-results-lower-commodity-
prices/ - “When Will Oil Finally Hit Bottom,” Investopedia, (2015), retrieved April 13, 2015, from http://www.investopedia.com/articles/investing/022315/when-will-oil-finnally-hit-bottom.asp
- Walsoft, “Why High Crude Oil Prices Are Likely Here to Stay,” The Market Oracle, (2015), retrieved
April 13, 2015, from http://www.marketoracle.co.uk/Article27493.html - “So Far, 2015 EV Sales Flat over 2014,” Energy Policy Information Center, (2015), retrieved April 13, 2015, from http://energypolicyinfo.com/2015/04/so-far-2015-ev-sales-flat-over-2014/
- Collin Eaton, “U.S. Rig Count Dives By 98, Baker Hughes Says,” Fuel Fix, (2015), retrieved April 13,
2015, from http://fuelfix.com/blog/2015/02/13/u-s-rig-count-dives-by-98-baker-hughes-says/ - Bassam Fattouh, “Current Oil Market Dynamics and the Role of OPEC Reflections on Robert Mabros Work,” The Oxford Institute for Energy Studies, (2015) retrieved April 13, 2015, from http://
www.oxfordenergy.org/wpcms/wp-content/uploads/2015/01/Current-Oil-Market-Dynamics-and-
the-Role-of-OPEC-Reflections-on-Robert-Mabros-Work.pdf
