The financial crisis of 2007-2009 and the current economic crisis are events of historical proportions. Yet, more than three years after the global finance markets came to a screeching halt, there is still limited consensus on what caused the financial crisis.
This is to be expected, since many of the early opinions on what led to the crisis—stock market collapse, liquidity shortage, and widespread threat of bankruptcy among banks, businesses, households, and sovereigns alike—were formed before all of the data was available. As a result, many of the conventional narratives about the financial crisis contain inaccuracies or inconsistencies.
A significant amount of research has already been made about the financial crisis, so it might not seem that another primer is necessary. But the geographical distribution of the effect of the financial crisis and economic crisis is significant, extending from the USA to Europe and having bi-directional ramifications on Asia. The impact on both individual and sovereign wealth is substantial. And future investment strategy, fiscal policy, and international financial coordination will all be considered in the context of the crises.
Many of the losses experienced were directly linked to the subprime debt that had previously been labeled triple-A by the major ratings agencies. As a result, there was a complete loss of confidence in the value of assets
It is, therefore, critical to fully and accurately understand the nature of the crises and their current state to ensure that the proper lessons are learned. This article aims to present a history on the causes of the financial crisis that first emerged in the U.S. in 2007. Then it will analyze the roots of the current state of the economic crisis in Europe and the U.S. It will also assess the effects of the crises on the European and American economies. A range of topics are discussed, some of which have received deeper treatment elsewhere in economic literature, but have not been pieced together to provide a coherent past and present picture of the situation. The paper will conclude with a brief comment on how this story relates to today’s economic environment and the next steps that need to be taken going forward.
Definition and a Broad Chronology of the Financial Crisis
In this section, we develop a general outline of times and events that define and delineate what we mean when discussing “the financial crisis.”
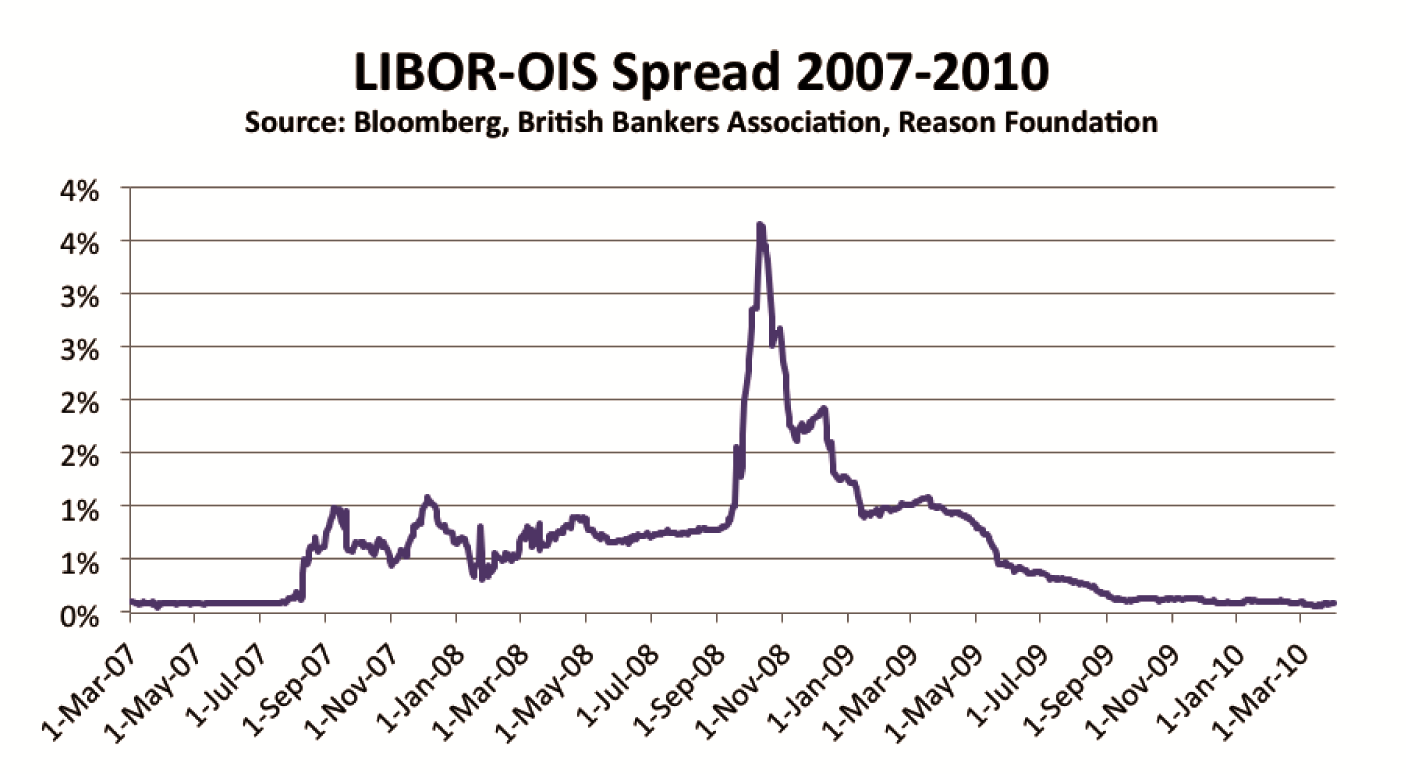
In August 2007, the spread between the three-month London Inter-Bank Offer Rate (Libor) and the Overnight Indexed Swap (OIS) rate spiked. 1 The Libor is primarily a measure of risk perceived by a bank when lending overnight to another bank. The OIS measures the market view of near-term risk of lending money day-to-day. Put simply, the Libor-OIS spread is an indicator of how the market feels about the level of risk in the system.
The spread shows that the market suddenly felt very concerned. The historical spread between the three-month Libor and OIS has been about 10 basis points (or 0.10%), but after a slow increase towards the end of July 2007, the spread hit nearly 50 basis points by August 10, 2007. By September 2007, the spread passed 90 basis points and liquidity came to a near standstill.2 Many have identified this as the start of the financial crisis, and we agree. Figure 1 shows the Libor-OIS spread from its 2007 lull to its peak in 2008, and subsequent return to normalcy by 2009.
Figure 1. LIBOR-OIS Spread 2007-2010
As we will discuss below, the reason that the Libor-OIS spread spiked was because of concerns about the subprime mortgage debt. For decades housing prices had been rising, allowing homeowners with subprime mortgages to simply sell their home if they ever became unable to make a payment. But when housing prices started to fall in 2007, the reasons of which are discussed in section 3.1, the ability to sell suddenly disappeared and very quickly a wave of mortgage defaults hit the financial system. As a result, the banks had to announce increasing high losses on their investments and assets (write-downs), with many of those losses related to toxic subprime mortgages. Total bank write-downs were $97 billion by the end of 2007, led by Citigroup with $13.2 billion in write-downs and $2.6 billion in credit losses.3 By September 2008, those losses had reached $591 billion globally.4
Many of the losses experienced were directly linked to the subprime debt that had previously been labeled triple-A by the major ratings agencies. As a result, there was a complete loss of confidence in the value of assets, which, due to mark-to-market accounting rules, led to further losses and more panic.
On July 11, 2008, the Federal Deposit Insurance Corporation (FDIC) declared IndyMac Bank to be insolvent and took it into receivership. This would be the first of three bank failures in July 2008, following only three bank failures in all of 2007, and zero bank failures in 2005 and 2006. The rate of bank failures would pick up dramatically in September 2008, including a bank run on Washington Mutual (sold by the FDIC to J.P. Morgan Chase) and the failure of Wachovia (sold by FDIC to Wells Fargo).
After reaching all time highs in the summer of 2007, the leading stock indices—S&P 500, Dow Jones, and the NASDAQ—all saw between a 10 percent and 15 percent drop from July 2007 to July 2008. In September and October 2008, the stock market fell off a cliff. The Government Sponsored Enterprises (GSEs)5 Fannie Mae and Freddie Mac were taken into conservatorship that August, followed by the failure of Lehman Brothers, a Federal Reserve bailout of A.I.G., the sale of Merrill Lynch to Bank of America, and mixed signals from the government whether or not Congress would authorize a bailout package for troubled assets. September 29, 2008 saw the largest point drop in the Dow Jones in history—a 778-point, or 7 percent decline. October 9 and 15 saw similarly shocking 7.3 percent and 7.9 percent drops respectively.
Such a dramatic event as the financial crisis of this size necessarily will have decades of ripple effect, if not more, and not all can be classified as the financial crisis
The overall slow down in financial market growth during this time period left many investors with few good places to put capital. Investors were in crisis in trying to find long-term growth potential anywhere they could justify it. Municipal governments struggled to get financing. Major corporations flirted with bankruptcy and sentiment caused consumption to contract.
After write-offs slowed in early 2009 and capital infusions came from the federal government through the TARP program, the drop off in stock prices hit a bottom in March 2009. Still, with bank failures mounting into the summer of 2009, the financial crisis pressed on. In July 2009, 24 bank failures, a peak number, occurred in one month, and in August 2009, bank failures in terms of asset size hit their post-Washington Mutual peak of $43.3 billion collectively in the month. Finally the dust settled, and the Libor-OIS spread fell from its October 2008 high of roughly 350 basis points down to 10 basis points on September 18, 2009, and it remained around that range for the next eight months. Thus, we consider September 2009 to be the end of the financial crisis.
We note that this concluding timestamp will draw some criticism. Such a definition necessarily requires a concluding point, however, and though some may argue we are still in the midst of a global crisis, we chose that date to mark the end of the general sense of panic in the marketplace over financial instability in the United States. We are aware that serious problems remained following September 2009, including the quantity of bank failures in 2010, a slow growth economy in the U.S. that continues to this day, and the sovereign debt crisis in Europe with significant effects on economic growth and unemployment. But such a dramatic event as the financial crisis of this size necessarily will have decades of ripple effect, if not more, and not all can be classified as the financial crisis. In particular, we note from Reinhart and Rogoff (2009) that sovereign debt crises such as the one currently besetting Europe and creating its own financial instability typically follow events as the one seen in the U.S. from 2007 to 2009. But again, this is an event to be defined in-itself, related to the financial crisis, but not a part of it.
Causes of the Financial Crisis
This section discusses the causes and propagation of the crises in the USA and Europe. We first review the USA and then move on to Europe.
Causes of the Crisis in the USA
The story of the financial crisis begins with the federal housing policy in the United States. Without housing subsidies and regulations changing in the 1990s, a climate for very low quality subprime related lending and investment never would have been cultivated or become so popular in the 2000s. U.S. federal housing policy is a primary cause of the financial crisis.
The prime tools of U.S. housing policy were the quasi-privates, GSEs, nicknamed Fannie Mae and Freddie Mac, and the government agency the Federal Housing Administration (FHA). Starting in 1990, the U.S. Congress directed Fannie and Freddie to lower lending standards to fit political goals in Washington and to build political power. Together with decreased standards at FHA, this led to a large volume of subprime mortgages that were securitized and sold to investors and banks.6 By 2008, the government—through the GSEs, FHA, and the Federal Home Loan Banks’—was guaranteeing the payments on 74 percent of all mortgages that had been issued without documented income, without downpayments, as interest only mortgages, as investor-owned property, or to buyers with low FICO scores.7
The story of the financial crisis begins with the federal housing policy in the United States. A catalyst for the housing policy to be effective was loose monetary policy, another primary cause of the financial crisis
GSEs played an important role in the financial crises that threatened and undermined the US economy. Without these government-sponsored enterprises buying up and guaranteeing poor quality mortgages, the financing for subprime lending available would have been substantially less and the housing bubble would not have grown the way it did. Without the housing bubble growing to the levels seen in 2005 and 2006, there would not have been such a catastrophic collapse in prices that led to so many of the poor quality borrowers defaulting and collectively causing large levels of losses that shook financial institutions to their core. Finally, without the GSEs and their affordable housing goals that started a long-term bubble in the 1990s, which fully inflated in the 2000s, there would not have been a market for securitized subprime loans for the private sector to engage in in the first place.
A catalyst for the housing policy to be effective was loose monetary policy, another primary cause of the financial crisis. Following the dot-com bubble induced 2001 U.S. recession, the Federal Reserve lowered interest rates to boost economic expansion. Other central banks also lowered interest rates around this time. That led to a long period of low interest rates triggering credit expansion by banks and other financial institutions. Housing prices were already well on their way above normal levels from subsidy driven federal housing policy kick started in the 1990s, but the low interest rates particularly enticed investments in mortgage-related products and helped push housing prices up to historic heights.
The question of why low interest rates caused money to flow into housing instead of creating a bubble in other assets deserves an explanation. “Basel” rules that created capital requirements for financial institutions incentivized investments in mortgages, GSE-backed mortgage-backed securities (MBS), and sovereign debt over business loans. Basel rules said that standards business-related loans were five times more risky than buying MBS with a triple-A rating, such as one guaranteed by Fannie Mae and Freddie Mac, so if you made a loan to a business you had to have five times the amount of capital, which was expensive. It did not matter that the GSEs were guaranteeing securities full of risky subprime debt or that business loans could be to very stable borrowers. And with the GSEs setting market standards low and providing steady financing for low quality mortgages, capital flowed heavily to housing ultimately resulting in the housing bubble.8
The unintended consequences of the poorly designed Basel rules for risk-based capital requirements were made worse by the so-called “Recourse Rule” adopted in 2001 effective solely in the United States. This rule extended Basel’s risk differentiations to asset-backed securities, thus only requiring a 2 percent capital cushion for mortgaged backed bonds that were rated triple-A, double-A, or simply if they were issued by a GSE.9 The result was to encourage banks to push capital towards housing backed bonds issued by the GSEs or rated triple-A by a ratings agency because of their favorable treatment under capital requirement rules, and by 2008 approximately 93 percent of all mortgage-backed securities held by commercial banks were cleared by the Resource Rule. Therefore, capital requirements as directed by the Basel Accord creating incentives to invest in housing related securities are a third primary cause of the financial crisis.
A leading secondary cause of the financial crisis was the ratings issued that allowed for Basel rules to become so distorted. The main failure of the ratings agencies was to believe that housing values would keep going up. This assumption was a core reason that securities with low quality mortgages, and collateralized debt obligations (CDOs) with the riskiest tranches of securities with low quality loans got triple-A ratings, which banks then invested in heavily due to the way capital requirements were written. The ultimate result was a build-up of excessive risk on financial institution balance sheets.
Ratings agencies failed to recognize this. Growth of asset bubbles initially lower the seeming odds of delinquencies and defaults by reducing the ratio of non-performing loans (NPLs)10 to the credit stock. That can create the illusion of otherwise suspect loans looking like good investments, because rising prices mean it can be easy to resell an asset if it becomes challenging to make a payment on a loan. During the housing bubble, subprime debt had high yields for investors because they were technically risky mortgages, but the asset bubble meant low default rates and low loss rates hid the real risk. The subprime debt instruments thus provided some kind of a free lunch to investors.
Without good risk assessment, including the arduous task of reading deeply technical and complicated security prospectuses, the risks that subtly build up during any bubble are likely to go unseen even to many of the best institutional investors. 11 While individual and institutional investors ultimately are still responsible for not fully understanding the risk of their investments, the ratings agencies abrogated the fiduciary duty they had taken on in not adequately analyzing the subprime MBS they rated triple-A for investors to dupe themselves into unstable investment positions.
Ultimately, none of this would have been possible without households buying into the conventional wisdom that real estate prices would always rise and that large amounts of personal debt were not a problem. But by 2006, the Federal Reserve’s fear of increasing inflationary pressures led them to hike the Fed Funds Rate, which drove up market interest rates, in particular the interest rates on the outstanding floating rate mortgage credits. Mortgage debt repayment difficulties ensued.
At the same time the so-called “flippers,” people who had been investing in real estate with a view to exit when the return profile was attractive, started to dump the real estate back in the market. The build-up of household debt, particularly the acceptance of high levels of short-term debt, made households inflexible when housing prices declined, home sales slowed, and the ability to refinance or sell and move disappeared. That led to a wave of defaults triggering the domino effect of losses in the financial sector that wound up circulating back to the Main Street economy in a vicious circle.
On some level moral hazard was deeply set in the system. The government had worked to bailout the financial system on a number of occasions in history, including events like the Continental Bank of Illinois collapse, the Savings and Loan Crisis, and the fall of hedge fund Long-term Capital Management. While few on Wall Street explicitly took risks thinking they were too-big-to-fail, the history of bailouts had prevented a culture of effective risk management from taking root in America’s major financial institutions. Put another way, because few buildings were ever allowed to burn to the ground, no one thought to think seriously about a new fire code for building construction.
At the same time, compensation practices led to misaligned incentives for both the executives of financial institutions as well as lower level management. A classic principal-agent dilemma formed as department managers worked to satisfy demand for high volumes of low-quality/high-yield mortgages and securitization methods, and banked their millions of dollars in bonus pay without effectively communicating to higher level staff the true risk inherent in their activities. Meanwhile, executives were focused on near-term earnings and not long-term stability. They had incentives to make sure their firms performed, since large percentages of executive compensation came in the form of stock options, but bonus pay that often rewarded near-term risk meant poor attention paid to risk management.
The transition of most financial institutions from private companies to publicly traded firms in the 1990s meant a shift in attitude from managing personal financial risk to trying to expand and hit growth targets to satisfy investors on quarterly earning calls. It also meant governing decisions made by boards of directors removed from day-to-day activities instead of partners making decisions with more intimate knowledge of the inner-workings of a financial firm. As a result, in an insatiable quest for growth with shortsighted financial targets, financial firms expanded larger than they could be effectively managed, and a host of investments in toxic, subprime debt—from the holding of triple-A rated CDOs that contained only first loss tranches of subprime-MBS to unsustainable liabilities on credit default swaps. This has often been described as irrational exuberance, but in fact it was very rational, but ignorant behavior.
Banking licenses that offered limited liability also influenced the behavior of financial institutions. Mostly built on 19th century bank licensing approaches that allowed bankers to borrow and lend without worrying about large losses to themselves (depositors took the hit instead), 20th century deposit insurance enabled banks to grow even more, since depositors no longer worried about how their funds were being deployed. These protections and hidden subsidies have enabled the financial industry to achieve enormous size and profitability, while placing the overall economy at great risk. The concept of being “too big to fail” may not have expressly been on the lips of most executives, but the government protections against taking the consequences of risk meant few were paying attention to the housing bubble’s build up of toxic debt throughout the financial system.
This explains why banks were holding some of the worst subprime debt when the financial crisis hit, and why they were lending to subprime borrowers even without Fannie and Freddie offering them guarantee subsidies. It was irrational behavior that was cultivated by a culture that lacked effective measures of accountability. Financial institutions are often blamed as causing the crisis by greedily making bad loans and investing too heavily in subprime MBS, but the reasons for their actions are a reflection of this much more complex historical narrative.
Further still, regulations were supposed to account for the moral hazard of deposit insurance and limited liability. These regulations usually failed to achieve their intended results—especially over the long term—because financial institutions are able to wear down the restrictions by lobbying and by hiring away key regulators. The Security Exchange Commission (SEC), Office of the Comptroller of the Currency (OCC), Office of Thrift Supervision (OTS), Federal Reserve, and Treasury Department were all very poorly equipped to take on their friends, peers, and future employers in the financial industry.
In retrospect, it is unclear if more strident regulations would have stymied the financial crisis, since any attempts to limit subprime mortgage issuance would have run counter to the federal government’s goal of expanding homeownership, which Fannie Mae and Freddie Mac were leading an effort to implement.
So why did the housing bubble cause a financial crisis when it popped?
When housing prices began to fall, it set off a wave of financial turbulence. Wide spread mortgage delinquencies and subsequent MBS losses across a range of supposedly safe investments forced banks to “mark-to-market” the value of MBS on their balance sheets in line with the market’s increasingly negative view of their worth and riskiness. This, combined with large mortgage loss write-downs, caused creditors to demand higher quality collateral or shut down lines of credit all together for financial institutions. In July of 2007, liquidity in the financial industry quickly dried up and accounting rules known as “mark-to-market” continued to force financial institutions closer and closer to insolvency over the following year.12
As risks of insolvency grew it became clear that the regulatory system was not adequately prepared to address the failure of one, let alone many large, complex financial institutions. It was not a matter of specific activities being unregulated as much as the lack of the ability to make those who failed from risky investment choices suffer the appropriate consequences. The failure of the bankruptcy system (or the failure to trust in the bankruptcy system) to provide for a faster resolution process of multiple large financial institutions meant there was little confidence in the system as a whole, once losses started to pile up.13 This further contributed to liquidity tightening (i.e. people stopped lending to each other).
As highly leveraged financial institutions became unable to find ways to borrow and finance their risky bets, and accounting gimmicks began starting to haunt bank managers, trust in the value of supposedly triple-A rated investments disappeared and widespread insolvency started to look like a serious possibility.14
In March 2008, Bear Stearns was forced to sell itself to J.P. Morgan Chase for a tiny sum of money and the Federal Reserve Bank of New York arranged to take on $29.5 billion worth of losses from the defunct institution to ensure the sale.
The current economic crises in Europe can be traced to two prime drivers: irresponsible fiscal policy and irresponsible bank lending practices
In August of 2009, Fannie Mae and Freddie Mac were placed under government control to avoid bankruptcy. The government established a $200 billion fund to backstop losses at the GSEs, later expanded to an unlimited backstop for GSE losses. While this created a sense of confidence that financial institutions would not take losses on GSE-MBS, there was still a large portion of private label mortgage-backed securities taking losses.
In September of 2008, the market lost confidence in Lehman Brothers. The government was unable to arrange an overnight sale of the financial firm and the bank was forced to file for bankruptcy.
The following day, the Federal Reserve announced it would purchase 80 percent of the shares of the insurance giant American International Group, which was suffering large losses on insurance contracts made to investors and institutions hedging against possible mortgage losses.
The mixed signals sent to the market place as a result of three firms being bailed out (Fannie, Freddie, and AIG), while another was allowed to fail (Lehman) caused a panic of uncertainty and stock markets around the world plunged. Other factors also came into play including credit derivative losses that exacerbated the panic, automatic “sell” triggers in programed trading systems, and the flight to quality related to exchange traded funds (which usually are correlated with stock indices).
As mentioned in the previous section, late September and early October saw an absolute collapse in the value of the Dow Jones, the NASDAQ, and the S&P 500.
While many have argued that the failure of Lehman Brothers triggered the collapse in the stock market, it is our view that the inconsistent approach of the federal government caused more to drain confidence from the system. Simply allowing all insolvent firms to fail, and depending on the FDIC and bankruptcy code to sort out the resolution process could have resulted in investors looking to move their equity shares from unstable companies to stable firms, rather than just pulling out of the market all together.
During this time, Merrill Lynch sold itself to Bank of America to prevent an implosion. Washington Mutual was declared insolvent and sold to J.P. Morgan Chase. Wachovia was taken over by the FDIC and sold to Wells Fargo after suffering too many mortgage related losses. In total, 143 banks failed between July 2007 and October 2009, with over 270 more coming after that (as of December 2011).
Shortly after the financial crisis appeared in the U.S., it became evident that European governments, with a few exceptions, had been building up a massive pile of risky debt
To preserve other banks during the financial crisis, the U.S. Congress approved $700 billion for the Troubled Asset Relief Program, which the Treasury Department used to buy stock in 707 banks and infuse them with capital to avoid insolvency.15 The Federal Reserve meanwhile loaned $7.8 trillion to financial institutions at below market rates to provide cheap access to financing—although many firms that did not really need the money took the free cash and loaned it back to the government through the form of Treasuries and banked the interest rate spread.16
By March of 2009, the stock markets had bottomed out, though the banking system remained challenged. Bank failures continued to mount into the autumn of 2009. But the Libor-OIS spread finally fell back to its historical trend line in September and October of 2009, and concerns about an imminent collapse of the global financial system had passed.
In conclusion, the causes of the financial crisis were triggered by household balance sheets that took on unsustainable debt, which could not be repaid, and resulted in a host of mortgage delinquencies. This resulted in losses for the balance sheets of financial institutions that had gamed the Basel capital requirements and took on too much debt themselves, made possible by Fannie Mae and Freddie Mac, low interest rates by the Federal Reserve, poor analysis from the ratings agencies, and misaligned incentives from years of bailouts, executive compensation practices, and corporate governance structures. The government contributed to the misaligned incentives with its accounting rules, limited liability for banks, inflexible mark-to-market accounting, and the over focus on trying to stop conceivable harmful practices without having a well designed bankruptcy and a resolution code for dealing with multiple large financial institutional failures at the same time.
Causes of the Economic Crisis in Europe
The current economic crises in Europe can be traced to two prime drivers: irresponsible fiscal policy and irresponsible bank lending practices. This section presents an overview of these two drivers.
While the mortgage finance market triggered the financial crisis in the U.S., errant fiscal policy across the Eurozone during the years leading up to unsustainable fiscal positions was the main driving force behind today’s economic crisis. It subsequently became evident that, under surprisingly weak risk assessment practices, European banks became highly exposed to lavish sovereigns.
Shortly after the financial crisis appeared in the U.S., it became evident that European governments, with a few exceptions, had been building up a massive pile of risky debt, with ensuing imbalances both in the banking sector and on sovereign balance sheets. Moreover, the woes of both banks and sovereigns were highly interrelated; in some countries both of these actors were in trouble, and in others the banks were highly exposed to their home country’s debt in addition to the debt of other European sovereigns.
The exposure of the European banking system to European sovereigns had been a result of lavish fiscal policy of some of the European countries. A small economy, Greece, had built up foreign borrowing to the tune of €239 billion by the end of 2007, representing 105 percent of the country’s GDP. When selected other sovereigns were added to the list, total foreign borrowing had reached a formidable level prior to the crises. On the other hand, as Table-1 shows, the costs of the financial crises led to a quick and dramatic rise in debt-to-GDP ratios by 2010 due to fiscal impetus programs as well as government financial assistance to banks. A major part of the outstanding public debt had been on the balance sheets of the banking system of each sovereign as well as banks in other European countries. That meant that sovereign insolvency or illiquidity would directly damage bank balance sheets.
A second major factor was aggressive commercial bank lending to the real estate sector that subsequently damaged the bank balance sheets.
In parallel to looming of the sovereign debt crises, some European country banking systems had also been exposed to worsening mortgage credit risks. Initial European financial problems emanated both from the so-called toxic assets imported from the U.S. and also from its own lending to the mortgage sector and to sovereigns.
Table 1. The Course of Gross Sovereign Debt in Selected European Countries
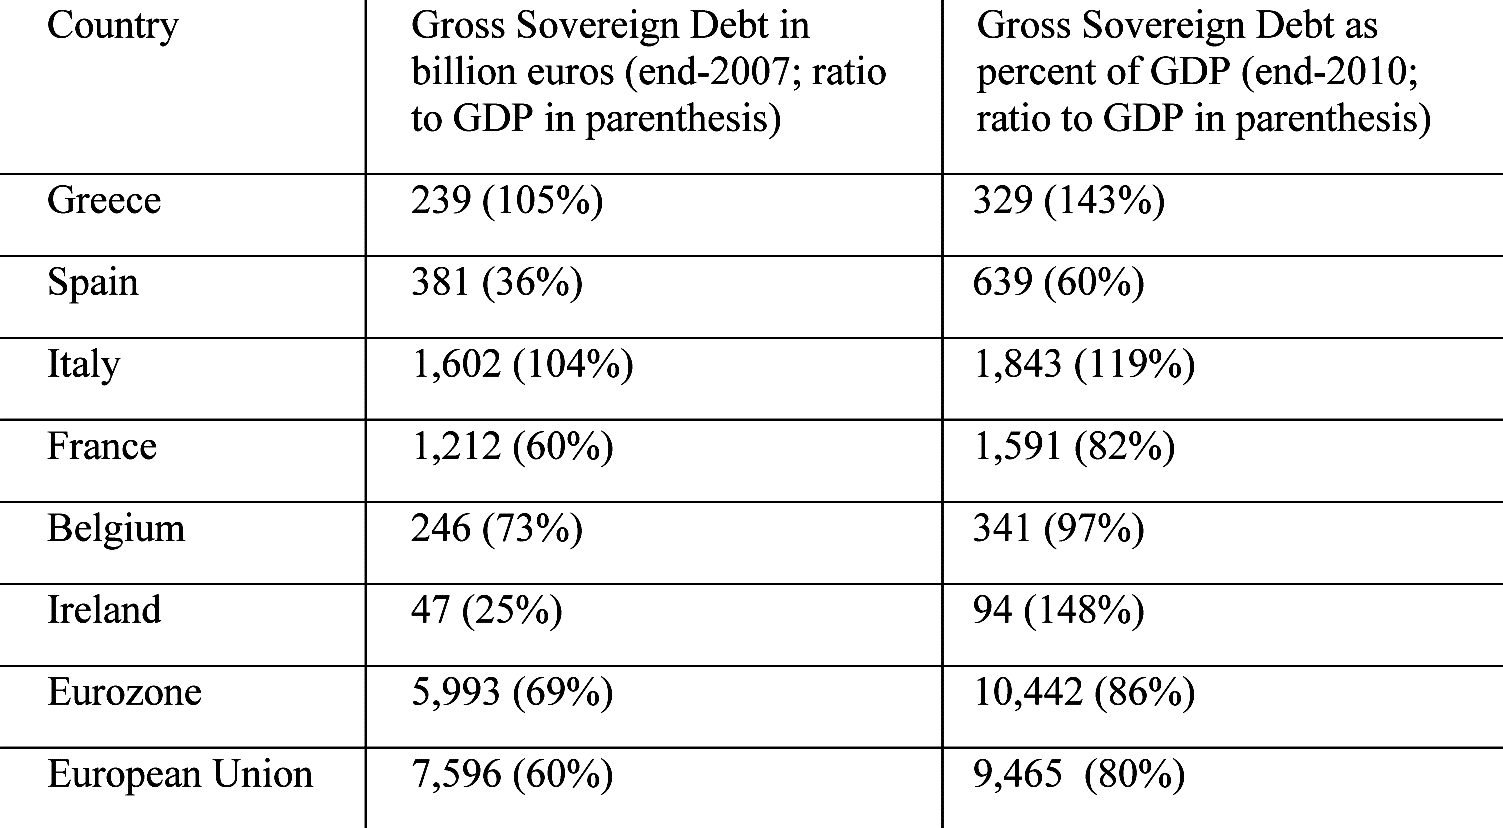
Source: IMF
Following losses in the mortgage and housing credit sector, the mortgage bank Northern Rock plc became an early casualty in the U.K., and was nationalized by the British government in 2008. However, aggressive bank lending to the real estate sector was not limited to the U.K. Spain and Germany were among the other prime examples. Germany started bank bailout packages as early as in October 2008.
The European macroeconomy faces significant risks. Bailout costs have been a significant driving force of fiscal worsening
The phenomenon was not limited to Europe’s developed economies. In Ukraine for example, the domestic banking system has lent aggressively to the housing sector since the beginning of the decade and fueled an unsustainable rise in housing prices. The Ukrainian banks for example, which were mostly foreign owned, had borrowed easily and heavily from Europe and other sources and lent these funds to the housing sector. The result was the balance sheets of both banks and housing owners becoming inflated significantly beyond real value. The price of housing in Kiev multiplied almost eight times between 2001 and 2008.17 Ultimately, the Ukrainian banking system collapsed leading to an IMF bailout support of $16 billion.
Where do We Stand Now?
The previous section gave an overview of the causes and the development of the financial crisis in the U.S., and the economic crisis in Europe. This section explains where the US and European economies stand currently.
The European Economy
The European macroeconomy faces significant risks. As a matter of classification, these risks are (i) mostly concentrated in sovereigns and banks rather than businesses; (ii) they are interrelated with each other; and, (iii) they have direct negative bearings on businesses in terms of growth and employment performance.
Sovereign risks have led to increasing and volatile borrowing costs and CDS spreads for countries associated with high-risk reception. On the other hand, the “flight-to-quality” process leads to increased bond prices and hence reduces the borrowing costs for a few countries perceived to be carrying relatively less risk of repayment such as Germany, Switzerland or the USA.
European sovereigns have problems relating to both flows and stocks. The flow problems emanate from the worsened budgetary balances. In the aftermath of the financial crises, notwithstanding the peripheral economies, budget deficits in many of the core European economies peaked at unprecedented levels. As a ratio to GDP, budget deficits reached 7.6 percent in France, 10.3 percent in the U.K., 5.3 percent in Italy. Germany seemed to be the only country that showed fiscal resilience (3.1 percent). The largest five European economies’ combined budget balance has thus worsened from a slight surplus of €4 billion in the year 2000 to a deficit of some €600 billion in 2009 and 2010.
Bailout costs have been a significant driving force of fiscal worsening. While not all bailout activity caused actual cash costs, the size of the package was enormous. The European Commission estimates that the state-aid approved by the EU-27 countries to fight against the adverse effects of the combined financial crisis and economic crisis was €4.5 trillion (37 percent of total EU-27 GDP) during the three years prior to October 201118. This aid included state guarantees on bank liabilities, bank recapitalization and relief on impaired bank assets. About 75 percent of the state–aid was approved in the last quarter of 2008 most of which was in the form of guarantees. After 2008 the emphasis of the state-aid was shifted towards bank recapitalization and impaired asset relief (see Figure 2).
Figure 2. Budgetary balances in selected European countries

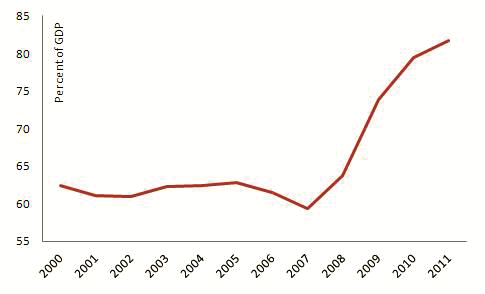
On the other hand, the flow problem is compounded by the stock problem through the generated debt overhang that will constrain the European economies for quite a while. Countries like Belgium and Italy traditionally had high public debt. However, the public debt levels in these and many other European countries increased sharply from where they were prior to the crises and are projected to remain high during the next decade (see Figure 3). The situation has even led to some economists talk about reducing the European debt via inflation.18
Figure 3. EU Sovereign Debt
The European banking system is highly integrated regionally; total consolidated foreign claims of European banks stood at 19 trillion euros at end-June 2011. Of this, 50 percent ($9.3 trillion) represent the claims of European banks on borrowers in other European countries. Countries with larger banking sectors naturally have a larger share in foreign claims (Table 2) and there is a significant concentration in exposures. Banking systems in three countries (Germany, France, and the U.K.) have a total of $5 trillion of exposure to other European sovereigns.
Table 2. Outstanding Foreign Claims of US and European Banks (in billions of US dollars)*
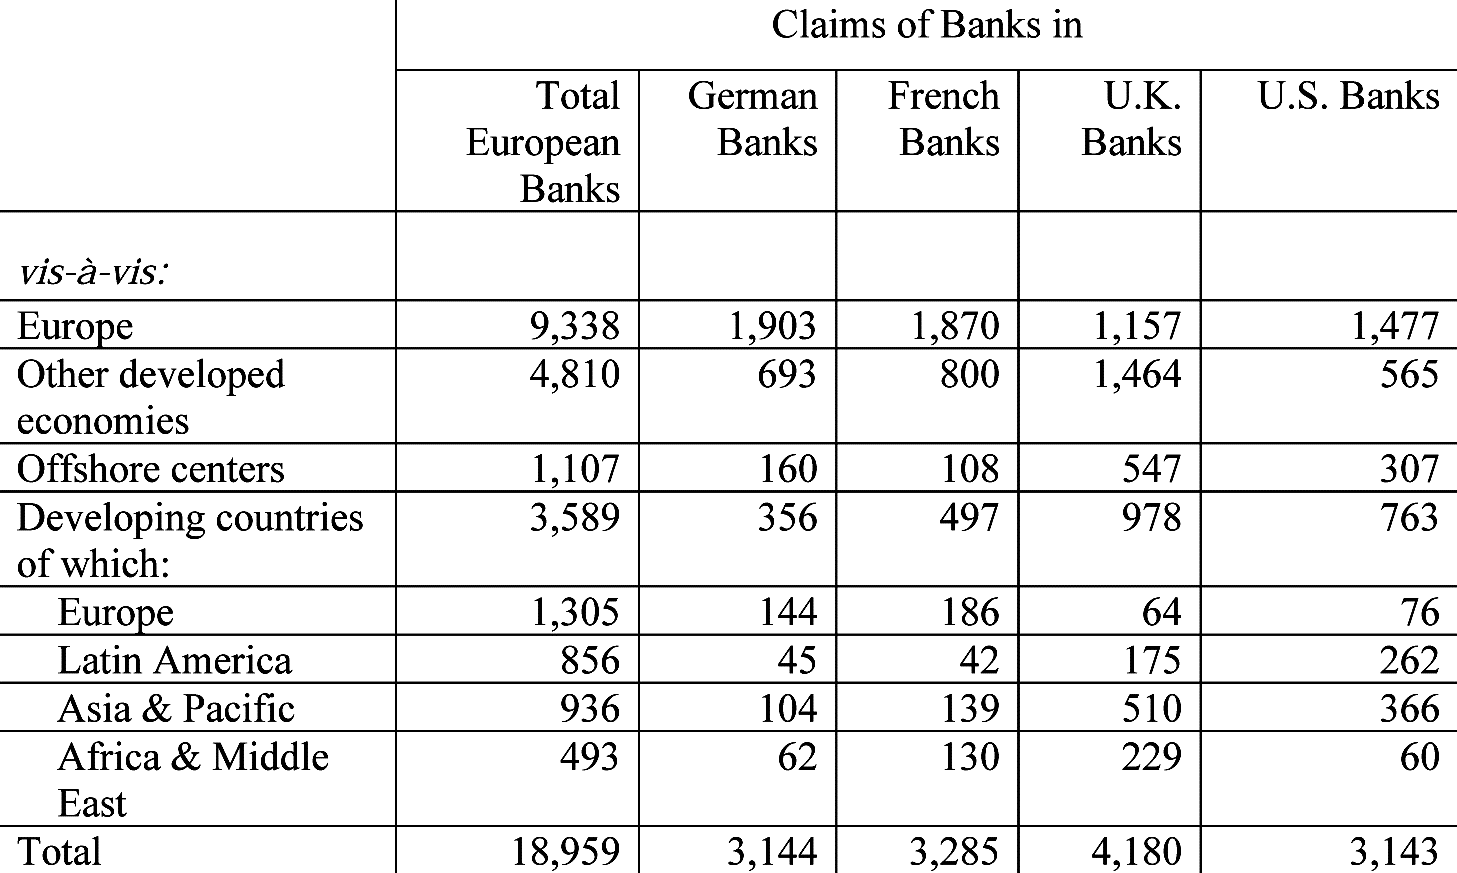
Source: BIS Quarterly Review, December 2011.
* Some columns may not add up due to rounding.
Deepened financial integration in Europe, not a bad thing per se, has made European banks highly vulnerable to the repayment capacity of European sovereigns, notwithstanding the European businesses. European banks have high exposures to economies that are experiencing increasing risk perception such as Italy, Spain, and Greece (Table 3). Moreover, the relationship between the European macro economy and bank balance sheets is obviously bi-directional. Worsening European economy directly affects the European bank balance sheets, and vice versa.
European banks’ foreign exposures are not evenly distributed. While countries with large banking sectors—Germany, France, U.K., Italy, and Spain—carry the majority of the foreign bank risk exposure, the exposure location for these larger players is concentrated in “favored economies” with which their economies have deeper integration. For example, according to December 2011 BIS figures, French banks have an exposure of $416 billion vis-à-vis Italian borrowers (public sector, non-financial private borrowers, and financial institutions) whereas their exposure is only $40 billion to Spain, which has a more or less comparable economic size to Italy. Similarly, Spanish banks’ foreign claims against Portugal are equivalent to $88 billion, in contrast to only $1 billion against an officially larger economy, Greece.
Table 3. Outstanding Total Foreign Claims of European Banks (in billions of US dollars): Selected Borrowers*
Source: BIS Quaterly Review, December 2011.
*Some columns may not add up due to rounding.
Moreover, as foreign exposures of European banks include sovereigns as well as businesses and banks, the situation becomes even more complex. For example, French banks have a total risk of $106 billion in Italian government debt and another USD 44 billion against Italian banks. If the Italian sovereign suffers a repayment difficulty (be it because of an insolvency or a liquidity issue), French banks may be hit both because of their direct sovereign exposure as well as indirectly through the Italian banks, which carry a significant amount of Italian bonds in their balance sheets.
In the U.S., the financial crisis left the banking sector on life support and pushed capital that would otherwise be invested into the economy to the sidelines
The financial crises impacted the real economy even more severely. The growth of the European economies collapsed, from their already traditionally low levels. Unemployment spiked. In severely hit countries such as Greece and Spain unemployment went beyond 15 and 20 percent respectively from less than 10 percent prior to the crises and GDP growth slumped.
Paradoxically, European businesses remained relatively resilient despite dramatically low economic growth. One explanation of this is that high unemployment has provided a cost cushion for European businesses by reducing their operational costs while increasing their efficiencies.
The banking industry is back on stable ground; the status quo is decidedly trending towards a more stable banking environment
The American Economy
In the U.S., the financial crisis left the banking sector on life support and pushed capital that would otherwise be invested into the economy to the sidelines. Though the financial crisis technically ended in September of 2009, the fallout extended well into 2010 and 2011. Toxic debt related to subprime investment is still heavy on some bank balance sheets, and losses relating to mortgage “put backs” (when the seller of a mortgage is required to buy it back if the buyer can demonstrate the seller knowingly sold a mortgage with weak underwriting characteristics) have yet to be fully worked out. Additionally, problems related to the servicing of bubble era mortgages and the persistent struggle with foreclosures also haunt the financial industry.
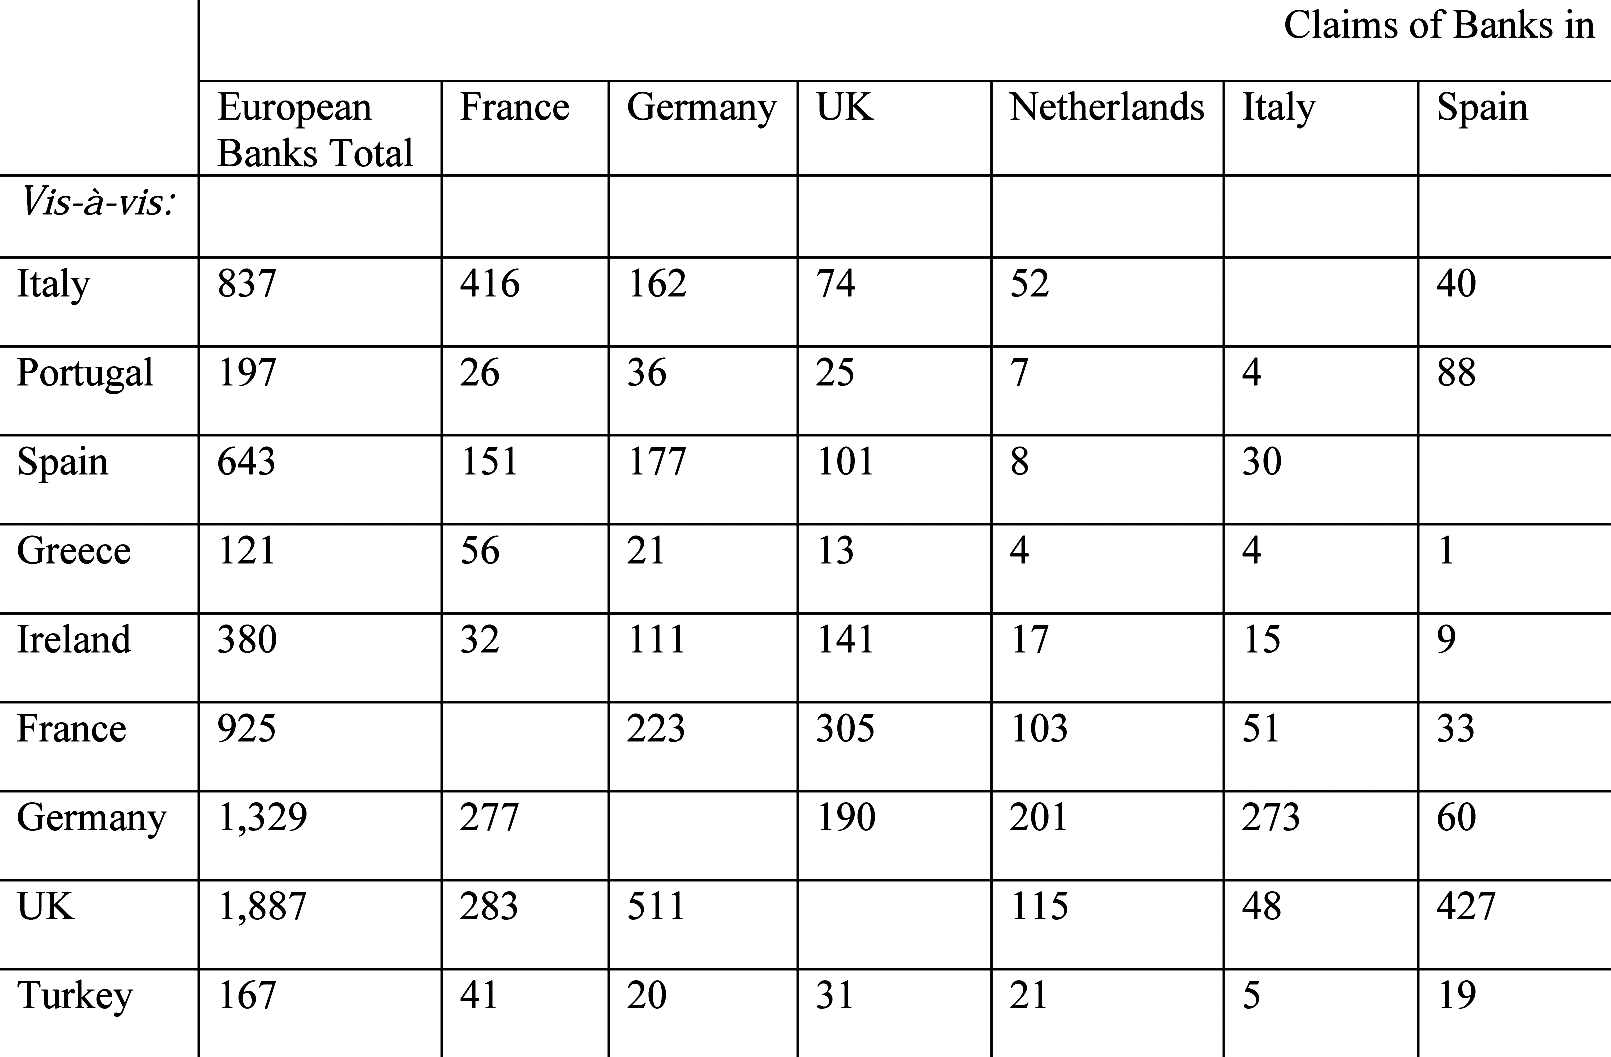
Another impact from the financial crisis that continued to be felt after its technical conclusion is bank failures—defined when the Federal Deposit Insurance Corporation determines a federally chartered bank is insolvent and takes it into receivership to be sold or liquidated. Bank failures reached a peak in June 2009 with 24 banks having their doors shuttered. As can be seen in Figure 4, the monthly rate of bank failures remained high for the following year, but has since slowed considerably.
The banking industry is back on stable ground; the status quo is decidedly trending towards a more stable banking environment. The bank capital structures have been somewhat strengthened and corporate liquidity have been at an all time high at end-2011. Under the low interest rate policy of the Fed, the cost of borrowing for U.S. banks has fallen from the highs of the early crises. Meanwhile, reported average bank profitability has reached 8 percent in 2011 from negative rates in 2010 and many of the banks have repaid their borrowing from the Troubled Asset Relief Program. Thus, the US banking system seems to have gained a stable ground unlike their peers in Europe which, as explained in the previous subsection, are exposed to sovereign risks as well as risks of other European banks.
Figure 4. US bank failures
 Turning to the real economy, American corporations, like their European counterparts, have demonstrated resilience to the effects of the financial crises and the ensuing slow growth. The crisis has led to a significant contraction of US industrial production. This was followed by a somewhat strong recovery starting by mid-2010. More recently however, since the middle of 2011, the growth of industrial production started to slow down.
Unemployment may, as in the case of Europe, provide an explanation of the resilience of the U.S. businesses. By reducing employment significantly, American businesses are increasing their efficiency lowering their labor costs to cushion against the loss of demand for their products. U.S. unemployment peaked at 10.1 percent in October 2009. Since then, unemployment has been on a gradual downward trend but nevertheless remained above 8.5 percent at the end of 2011, according to the U.S. Bureau of Labor Statistics (see Figure 5).19
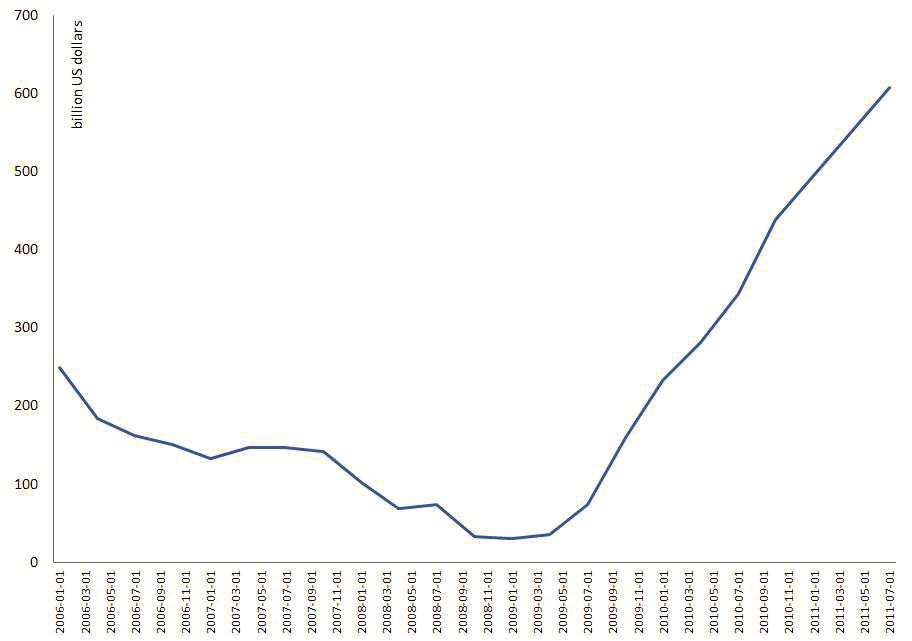
Another response by American business to the financial crisis has been a tremendous hoarding of cash. Checkable deposits and currency in the balance sheet of non-financial US businesses have increased from $33 billion at end-2008 to $608 in July 2011. When short-term investments are added the figure is even more pronounced; the cash and short-term investments of Standard & Poor’s 500 businesses reached $2.2 trillion at the end of the third quarter of 2011 (see Figure 6).
Figure 5. U.S. Unemployment
 Source: Federal Reserve Bank of St. Louis Economic Research
Figure 6. U.S. Corporate Cash Hoarding
Source: Federal Reserve Bank of St. Louis Economic Research
* Checkable Deposits and Currency in the Balance Sheets of Nonfarm Nonfinancial Corporate Businesses
The most plausible explanation of the corporate sector’s cash hoarding is hedging against uncertainty. While U.S. households are in a process of deleveraging, corporations are hoarding cash in addition to their own deleveraging process. The victim obviously is physical investment.
On the flip side of the story is the U.S. government. The American government has increased its borrowing considerably and increasingly since the Bush administration, leading to warning signals even from the Federal Reserve. However, the later episode of the financial crises has triggered an increased demand for assets perceived to be the safe havens. The clear winner has been US treasuries and German bunds. The process, when combined with the Fed’s (and ECB’s) low interest policy and low inflation expectations given mediocre economic activity led to record low interest rates on U.S. treasuries despite a lack of political consensus on a spending cut plan and a downgrading of U.S. sovereign debt by S&P.
What is certain is that fiscal and monetary tightening will have to be implemented sooner or later
Meanwhile, the government has ended the fiscal stimulus under the American Recovery and Reinvestment Act (ARRA) that was enacted in 2009. Whether or not ARRA and other fiscal stimulus programs have a positive effect on the economy remains a hotly debated question.20
In short, U.S. banks have somewhat stabilized; corporations are hoarding cash and reducing their investment outlays; households are deleveraging and thus containing their consumption; and, the government is trying to clean up its fiscal balances which is proving quite difficult despite low borrowing costs.
Conclusions
In this article, we have made a mid-term assessment on the causes of and current status of the financial crises in the USA and Europe.The financial crises has been a result of weaknesses in the U.S. and European economies. In the U.S., the unchecked and uncalculated housing credit boom catalyzed by government policies set the stage for the financial crises. In Europe, fiscal lavishness compounded with easy lending to the sovereigns in addition to housing lending played a similar role.
We argued in this article that technically the financial crisis is over after taking a serious toll so far. Banks have been closed; sovereigns are at de facto bankruptcy. Costly bailout packages have been launched. Consumer and business confidence in the economy has eroded.
More importantly, both in Europe and America the aftermath of the crisis is quite challenging for the governments and for the banks. This is especially the case for Europe, where a sovereign debt fueled economic crisis still remains. Political disputes are plaguing the process of recovery in both territories and make it more difficult to agree on a faster clean up.
All that makes it very difficult to precisely foresee how the aftermath of the debt crisis will evolve across borders and for the economic actors (i.e., governments, corporations, and banks). It is also difficult to estimate the combined effect of a debt crisis starting from a single European country. There is no strong evidence that a full-fledged clean up may be executed within a few years. There is also no strong evidence that a new round of financial-cum-sovereign crises as defined in this article may not follow. What is certain is that fiscal and monetary tightening will have to be implemented sooner or later. It is widely recognized that timing will be crucial; premature action may augment growth vulnerabilities and delayed action may lead to a long episode of inflation and sovereign debt spiral.
Endnotes
* The authors thank Eda Erkula and Zehra Akan for research assistance.
- John Taylor, Getting Off Track: How Government Actions and Interventions Caused, Prolonged, and Worsened the Financial Crisis (Hoover Institution Press, 2009).
- “3 MO LIBOR - OIS Spread,” Bloomberg , retrieved January 3, 2012, from http://www.bloomberg.com/apps/
quote?ticker=.LOIS3:IND - Yalman Onaran, “Subprime Bank Losses Reach $97 Billion, Led by Citigroup,” Bloomberg, (December 27,2007) , retrieved January 3,2012, from http://www.bloomberg.com/apps/
news?pid=newsarchive&sid= aADDTXvcUz1Y - Yalman Onaran and Dave Pierson,“ Banks’ Suprime-Related Losses Surge to $591 Billion: Table,” Bloomberg (September 29,2008), retrieved January 3,2012 from http://www.bloomberg.com/apps/
news?pid=newsarchive&sid=aSlW. imTKzY8 - The GSEs were created by the U.S. Congress to increase the availability of credit for lending to homebuyers so that the rate of homeownership in America would increase. As discussed in section 3.1, in practice, GSEs provide insurance to mortgage credits originated by commercial banks to facilitate securitization of these credits. Securitization of their outstanding mortgage credits transfers the credit receivables from the originating bank to the holders of the generated securities (bonds) purchased in secondary bond markets. Thus, securitization is a tool for the commercial banks to mobilize additional funds.
- Peter Wallison,“Financial Crisis Inquiry Commission Dissenting Statement” in The Financial Crisis Inquiry Report,(New York: Public Affairs, 2011).
- FICO score is a widely used tool to score the repayment risk of an individual borrower.
- Jeffrey Friedman and Wladimir Kraus, “Engineering the Financial Crisis” (University of Pennsylvania Press: Philadelphia, 2011).
- Jeffrey Friedman, “A Perfect Storm of Ignorance,” Cato Policy Report, Vol. 32, No.1 (January/February 2010).
- NPLs are outstanding bank loans that the borrowers are not servicing.
- The feature film “Chasing Madoff” produced around the actual event is a popular example of this. The book The Big Short by Michael Lewis documents a number of stories that also demonstrate the phenomenon of only a few investors actually reading the complicated MBS prospectuses.
- Jeffrey Friedman and Wladimir Kraus , “Engineering the Financial Crisis” (University of Pennsylvania Press: Philadelphia, 2011), chapter 3.
- Garett Jones and Katelyn Christ,“Speed Bankruptcy as the TARP Alternative,” Mercatus on Policy (February, 2010) .
- Victoria Ivashina and David Scharfstein,“Bank Lending During the Financial Crisis of 2008,” Journal of Financial Economics, No.3, (July 31,2009), pp 319- 38.
- “Capital Purchase Program,” U.S. Department of Treasury, retrieved January 3, 2012, from http://www.treasury.gov/
initiatives/financial- stability/programs/investment- programs/cpp/Pages/ capitalpurchaseprogram.aspx - Anthony Randazzo, “Trillion Dollar Bailouts Equal Crony Capitalism,” Reason Magazine (December 12,2011), retrieved January 3,2012 from http://reason.org/news/show/
the-feds-trillion-dollar- bailouts - Vahram Stepanyan, Tigran Poghosyan, and Aidyn Bibilov, “House Price Determinants in Selected Countries of the Former Soviet Union,” IMF Working Paper (April 1,2010), WO/10/104. This study concludes that external funding (through the banking system) has played an important role in the rise of prices. The study also concluded that its “results imply that house prices are highly vulnerable to the significant drops in remittances and foreign inflows and economic contractions that we have observed during the global financial crisis
- Carmen Reinhart and Belen Sbrancia, “The Liquidation of Government Debt,” BIS Working Papers, No 363, Basel, 2011.
- There is a debate over the proper way to determine unemployment in the United States. The official measure of unemployment, from the U.S. Bureau of Labor Statistics, discounts the impact of labor market participation in determining the rate of unemployment. However, the Congressional Budget Office estimates that if the labor force participation rate had remained in line with population growth trends, that unemployment rate would be closer to 10 percent as of the end of 2011, rather than 8.5 percent.
- John Taylor, “An Empirical Analysis of the Revival of Fiscal Activism in the 2000s,” Journal of Economic Literature, Vol.49, No.3 (September, 2011).
